Fig. 1
|
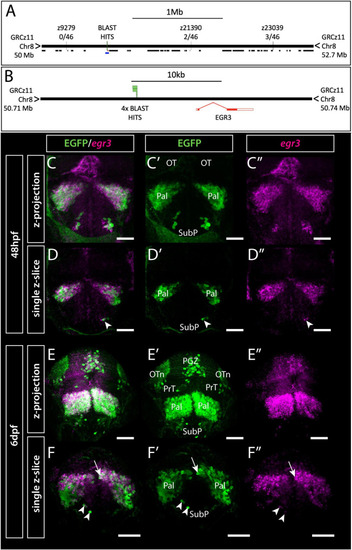
Et(gata2:EGFP)bi105 insertion is located near egr3 and expression of egr3 matches transgene expression. (A,B) Mapping of Et(gata2:EGFP)bi105 insertion showing the position of Genome Walker BLAST hits on assembly GRCz11, relative position of neighboring genes (black lines) and linkage markers with meiotic recombination data (A), the lower blue line in panel (A) indicates the region around egr3 shown in panel (B), with BLAST hits (insertion) locations. BLAST/BLAT coordinates: 8:50720195-50720677 (C?F?) Immunostaining and in situ hybridization showing EGFP and egr3 mRNA co-expression in the telencephalon and optic tectum of Et(gata2:EGFP)bi105 fish at 48 hpf (C?D?) and 6 dpf (E?F?) in frontal view. Panels (C?C?,E?E?) show z-projections and panels (D?D?,F?F?) show single z-slices. Note the co-expression of EGFP and egr3 in pallial (arrow) and subpallial (arrowheads) cells. Scale bars: 50 ?m. |

