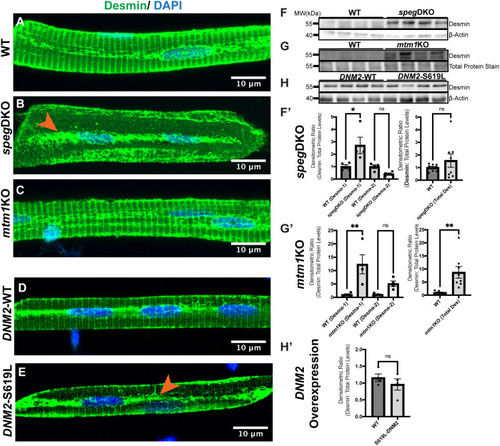
Desmin subcellular localization and protein levels in zebrafish models of CNM. (A-D) Myofibers were isolated at 5 dpf (speg-DKO), 7 dpf (mtm1-KO) and 3 dpf (DNM2 overexpression), and stained with anti-Desmin (green; D8281, Sigma-Aldrich) and DAPI (blue, nucleus). (A) At 5 dpf, Desmin is normally localized to the sarcolemma, perinucleus and the sarcomeric Z-disks (as transverse striations). (B) In speg-DKO (5 dpf), Desmin is predominantly localized to the perinucleus (orange arrowhead). (C) In mtm1-KO (7 dpf), Desmin localization appears similar to that of WT siblings. (D,E) WT DNM2-EGFP-overexpressing myofibers show similar Desmin staining pattern to that of non-transgenic WTs (D), while DNM2-S619L DNM2-EGFP-overexpressing myofibers show loss of Desmin in transverse striations, with Desmin localization predominantly at the perinucleus (orange arrowhead) (E). Scale bars: 10 µm. (F-H′) Western blot analysis using whole-zebrafish lysates shows Desmin upregulation in 5 dpf speg-DKO (by 2- to 3-fold) (F,F′) and in 7 dpf mtm1-KO (by 5- to 10-fold) (G,G′) compared to WT siblings, but not in 3 dpf DNM2-S619L zebrafish (H,H′) compared to DNM2-WT controls. Each lane (F,G,H) or each dot (F′,G′,H′) represents n=25 zebrafish (40 µg of total proteins), four lanes represent four independent experiments. Densitometry was measured using Fiji ImageJ. Desmin protein levels were normalized to β-actin loading controls in speg-DKO and DNM2, or to REVERT total protein stains in mtm1-KO (as β-actin level is changed by the lack of Mtm1). Data are mean±s.e.m. Unpaired two-tailed Student's t-test: *P<0.05; **P<0.01; ns, not significant.
|
