
Figure 4
- ID
- ZDB-FIG-220430-61
- Publication
- Peng et al., 2022 - Proper migration of lymphatic endothelial cells requires survival and guidance cues from arterial mural cells
- Other Figures
-
- Figure 1
- Figure 1—figure supplement 1.
- Figure 1—figure supplement 2.
- Figure 2
- Figure 2—figure supplement 1.
- Figure 2—figure supplement 2.
- Figure 2—figure supplement 3.
- Figure 3
- Figure 3—figure supplement 1.
- Figure 3—figure supplement 2.
- Figure 3—figure supplement 3.
- Figure 4
- Figure 4—figure supplement 1.
- Figure 4—figure supplement 2.
- Figure 5
- Figure 5—figure supplement 1.
- Figure 5—figure supplement 2.
- All Figure Page
- Back to All Figure Page
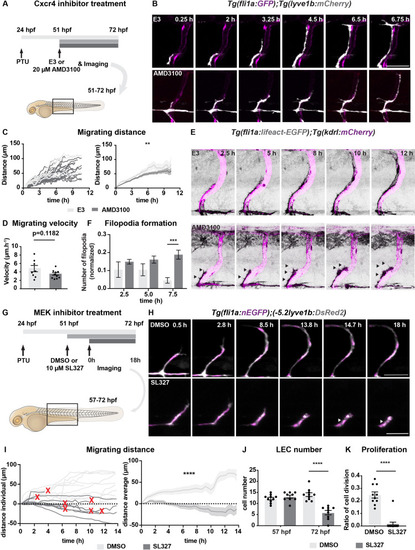
(A) Work flow of Cxcr4 inhibitor treatment. Tg(fli1:GFP);Tg(lyve1b:mCherry) embryos were grown in PTU (1-phenyl 2-thiourea) from 24 hours post fertilization (hpf) to prevent pigment formation, then changed to 20 ?M AMD3100 or E3 water (embryo medium) at 51 hpf. (B) Confocal stack images from time-lapse imaging of Tg(fli1a:GFP; lyve1b:mCherry) embryos as indicated in (A). Scale bar: 50 ?m. (C) (Left) Quantification of dorso-ventral migration showing individual tracks for the sprouting LECs in embryos (n = 6) in E3 water or embryos (n = 10) in AMD3100. (Right) Quantification of dorso-ventral migration showing average (mean from single tracks; left) of tracks in E3 and AMD3100-treated groups. Data are presented as mean � SEM, unpaired two-tailed Student?s t-test was used. **p < 0.005. (D) Quantification of velocity of dorso-ventral migration from time-lapse video described in (B). Sprouting front of LECs in E3 water (n = 6) and AMD3100- (n = 10) treated embryos were tracked and the distance between starting and end position of sprouting front was measured and subsequently divided by duration. Data are presented as mean � SEM. Unpaired two-tailed Student?s t-test was used. Ns, no significance, p > 0.1. (E) Confocal stack images from time-lapse imaging of Tg(fli1a:lifeact-EGFP);Tg(kdrl:mCherry) as indicated in (A). Arrows indicate dynamic filopodia formation during LEC migration. Scale bar: 50 ?m. (F) Quantification of frequency of filopodia formation from time-lapse video from (E). Number of protrusions in LEC sprouts were counted and normalized to the sprout length, control (E3, sprouts n = 8 from 8 embryos) and treated (AMD3100, n = 12 from 10 embryos) embryos. Data are presented as mean � SEM. Unpaired two-tailed Student?s t-test was used. ***p < 0.0005. (G) Work flow of MEK inhibitor treatment. Tg(fli1:GFP);Tg(lyve1b:mCherry) embryos were grown in PTU from 24 hpf, then changed to 10 ?M SL327, a MEK inhibitor, or DMSO at 51 hpf. Time-lapse imaging was started at 57 hpf. (H) Confocal z-stack images from time lapse of 57 hpf Tg(fli1a:nEGFP)y7 (green) and Tg(?5.2lyve1b:DsRed2) (grey) embryos treated with DMSO or 10 ?M SL327 from 51 hpf. Grey arrowheads indicate cell death. Scale bar: 50 ?m. (I) (Left) Quantification of dorso-ventral migration showing individual cell tracks for nuclei of sprouting LECs in DMSO- (embryos, n = 10; left panel) and SL327- (embryos, n = 9; right panel) treated embryos as described in (H). Red cross indicates cell death at the end of tracking. (Right) Average (mean) of tracks in DMSO- and SL327-treated groups. Data are presented as mean � SEM, unpaired two-tailed Student?s t-test was used. ****p < 0.0001. (J) Quantification of total LEC numbers at beginning (T0) and end (T1) of the time lapse of embryos (n = 10) in DMSO- and SL327-treated embryos (n = 9); data are presented as mean � SEM. T0 DMSO vs. T1 SL327 p < 0.0001, T0 SL327 vs. T1 SL327 p < 0.0001, T1 DMSO vs. T1 SL327 p < 0.0001. Other comparisons were ns. One-way ANOVA with Tukey?s post hoc test for statistical analysis. ****p < 0.0001. (K) Quantification of cell proliferation in DMSO (n = 9) and SL327-treated (n = 13) embryos as described in (E). Nuclear marker in green was used to count cell division events. Data are presented as mean � SEM, Mann-Whitney test was used. ****p < 0.0001. |