
Figure 1
- ID
- ZDB-FIG-220430-50
- Publication
- Peng et al., 2022 - Proper migration of lymphatic endothelial cells requires survival and guidance cues from arterial mural cells
- Other Figures
-
- Figure 1
- Figure 1—figure supplement 1.
- Figure 1—figure supplement 2.
- Figure 2
- Figure 2—figure supplement 1.
- Figure 2—figure supplement 2.
- Figure 2—figure supplement 3.
- Figure 3
- Figure 3—figure supplement 1.
- Figure 3—figure supplement 2.
- Figure 3—figure supplement 3.
- Figure 4
- Figure 4—figure supplement 1.
- Figure 4—figure supplement 2.
- Figure 5
- Figure 5—figure supplement 1.
- Figure 5—figure supplement 2.
- All Figure Page
- Back to All Figure Page
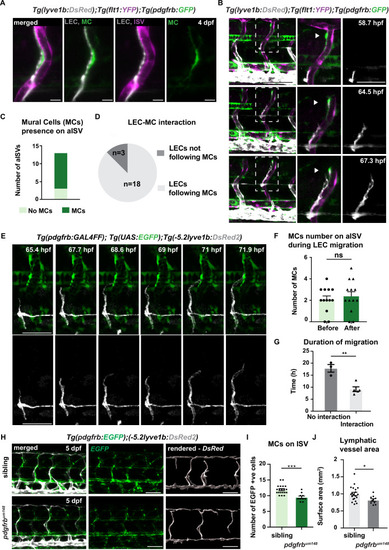
(A) Confocal stack image of trunk aISV in 4 dpf Tg(flt1:YFP); Tg(-5.2lyve1b:DsRed2);TgBAC(pdgfrb:GFP) of lymphatic endothelial cells (grey, LEC), arterial intersegments vessels (magenta, aISV) and mural cells (green, MC). Scale bar; 10 ?m. (B) Confocal stack images from time-lapse images in the trunk of 2 dpf Tg(flt1:YFP); Tg(-5.2lyve1b:DsRed2); TgBAC(pdgfrb:GFP) embryos (LECs in grey). Boxed regions are enlarged (right panels). Arrowheads indicate pdgfrb+ MCs (green) next to aISVs (magenta during LEC migration). Scale bars; 100 ?m or 50 ?m (enlarged image). (C) Quantification of aISVs with (n=10) or without (n=3) MCs presence from n=7 embryos when LECs left HM for time lapse videos as in (E). (D) Quantification of LEC and MC interaction during migration (n=10 embryos, with four somites counted per embryo). Migrating following MC n=18, migrating not following MC n=3 from time lapse videos in (E). (E) Confocal stack images from time lapse movies of LEC migration. TgBAC(pdgfrb:GAL4FF);(UAS:GFP) in green and Tg(-5.2lyve1b:DsRed2) in grey. Scale bar: 50 ?m (F) Quantification of MC number around aISVs (n=14) from n=7 embryos at the start and end of the migration, quantified from time lapse videos in (E). Data are presented as mean � SEM, unpaired two-tailed Student?s t-test was used. Ns, no significance. (G) Quantification of duration of LEC migration with (n=5) or without (n=3) contacting MCs from n=6 embryos. Data are presented as mean � SEM. unpaired two-tailed Student?s t-test was used. **p<0.005 (H) Confocal stack images of Tg(pdgfrb:GAL4FF); Tg(UAS:GFP) (green) and Tg(-5.2lyve1b:DsRed2) (grey) in the trunk of sibling (top) and pdgfrbum148 mutant (bottom) embryos at 5 dpf. Lymphatic vessle are rendered using lyve1b:DsRed2 channel in IMARIS s structure is rendered with lyve1b:DsRed2 channel in IMARIS (right panel). Scale bar: 100 ?m. (I) Quantification of pdgfrb+ mural cell numbers around ISVs in siblings (n=20) and pdgfrbum148 mutants (n=10). Data are presented as mean � SEM, Mann Whitney test was used. ***p<0.0001. (J) Quantification of surface area of lymphatic vasculature in siblings (n=20) and pdgfrbum148 mutants (n=10). Data are presented as mean � SEM, unpaired two-tailed Student?s t-test was used. *p<0.05.
|