
Fig. 7.
- ID
- ZDB-FIG-220414-22
- Publication
- Takesono et al., 2022 - Estrogens regulate early embryonic development of the olfactory sensory system via estrogen-responsive glia
- Other Figures
- All Figure Page
- Back to All Figure Page
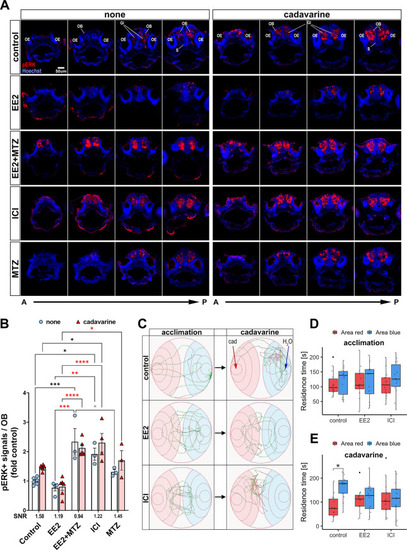
Estrogens inhibit olfaction-evoked neuronal activation and abolish olfaction-mediated avoidance behaviour. (A) Representative sequential forebrain transverse section images of pERK- (red) and nuclei (blue)-stained none (left) and cadavarine-stimulated (right) control, EE2-, EE2+MTZ-, ICI- or MTZ-treated 5 dpf ERE:mCherry larvae. (B) pERK signals within ?50 �m A-P volume of the OB of none (white bar/pale blue dots) or cadavarine-stimulated (red bar/red triangles) 5 dpf ERE:GFP larvae (n=3-6) are shown. *P?0.05, **P?0.01, ***P?0.001, ****P?0.0001 (ANOVA with Tukey post-hoc test). Black, red and grey asterisks show comparisons with control, EE2 and EE2+MTZ, respectively. Signal/noise ratio (SNR) was calculated as ?the mean of the odour-evoked pERK levels/the mean of the basal pERK levels? (shown below the x-axis). (C) Representative swimming trajectories of control (top row), EE2- (middle row) and ICI-(bottom row) exposed 9-11 dpf ERE:mCherry larvae. Trajectories (5 min) during acclimation (left column) and after cadavarine administration (right column) from the same larva are shown. The administration sites of either cadavarine (red arrow) or water (blue arrow) are indicated in control/cadavarine-stimulated trajectory (top/right). (D,E) Averaged residence time in red (cadavarine) or blue (water) area during acclimation (D) and after cadavarine administration (E) in control (n=14), EE2- (n=12) or ICI- (n=12) treated larvae. *P<0.05 (likelihood ratio test with Tukey's post-hoc test). Boxplots show the median with 1st and 3rd quartiles of the distribution. Whiskers extend to the minimum and maximum of the data range within 1.5� the interquartile range; data beyond that range are defined as outliers and plotted individually in black. Overlaying the boxplot is a scatterplot in semi-transparent showing all individual observations. A-P, anterior-posterior axis; Gl, olfactory bulb glomerular layer; OB, olfactory bulb; OE, olfactory epithelia; S, subpallium. |