Fig. 6
- ID
- ZDB-FIG-220307-20
- Publication
- Gao et al., 2022 - Pluripotency factors determine gene expression repertoire at zygotic genome activation
- Other Figures
- All Figure Page
- Back to All Figure Page
|
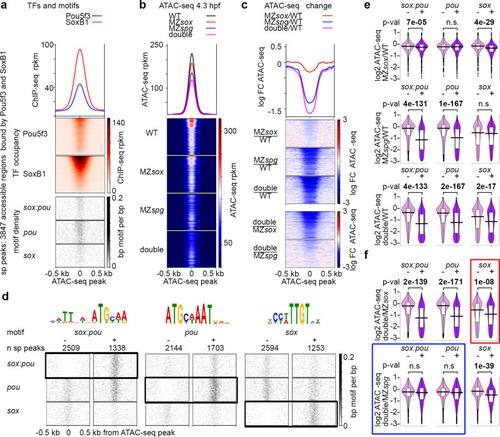
Pou5f3 and Sox19b regulate chromatin accessibility on different motifs.
a?c 3847 accessible regions bound by both Pou5f3 and SoxB1 (sp peaks) were used for analysis. For the heatmaps, the regions were sorted by descending SoxB1 Chip-seq signal. a Heatmaps show TF occupancy and motif density on sp peaks. b Chromatin accessibility on sp peaks is reduced in the single and double mutants at 4.3 hpf. c Chromatin accessibility change. Three top heatmaps: mutant to wild-type change. Two bottom heatmaps: double to single mutant change. Note the strongest chromatin accessibility reduction in the double mutant and the weakest in MZsox19b. d Chromatin accessibility changes at 4.3 hpf were compared between sp peaks without (?) or with (+) motifs indicated above (e, f). Scale-motif density. e Mutants to wild-type change. Sox19b binding to sox motifs and Pou5f3 binding to pou motifs promotes chromatin accessibility. On sox:pou motifs, binding of any factor has a significant effect, but Sox19b effects are weaker. f Double to single mutant change. Blue frame: on sox:pou and pou motifs, chromatin accessibility is similarly reduced in the double MZsox19bspg mutant compared to MZspg. Hence, the gain of chromatin accessibility on sox:pou and pou motifs results from Pou5f3 binding. On some of sox:pou motifs Sox19b may act by facilitating or stabilizing Pou5f3 binding. Red frame: on sox motifs, chromatin accessibility is stronger reduced in MZsox19bspg compared to MZsox19b, suggesting additive or redundant effects of Pou5f3. As shown at Fig. S7g, this effect is due to the sp peaks where both types of motifs (sox and sox:pou or sox and pou) are present. Hence, Pou5f3 and Sox19b may promote chromatin accessibility additively or redundantly when they bind to different motifs within the same AR. MZsox = MZsox19b. At e, f: The lower border, middle line and upper border of the white box plots correspond to 0.25, 0.5 (median), and 0.75 quantile, respectively. n(wt) = 3, n(MZspg) = 3, n(MZsox19b) = 3, n(double) = 4, where n is a number biologically independent ATAC-seq experiments. P-values in two-tailed Student?s t-test. Source data for b, c, e, and f are provided as a Dataset S3. Source data for a, d are provided as Dataset S4. |

