FIGURE
Fig. 7.
- ID
- ZDB-FIG-220304-8
- Publication
- Allanki et al., 2021 - Interleukin-11 signaling promotes cellular reprogramming and limits fibrotic scarring during tissue regeneration
- Other Figures
- All Figure Page
- Back to All Figure Page
Fig. 7.
|
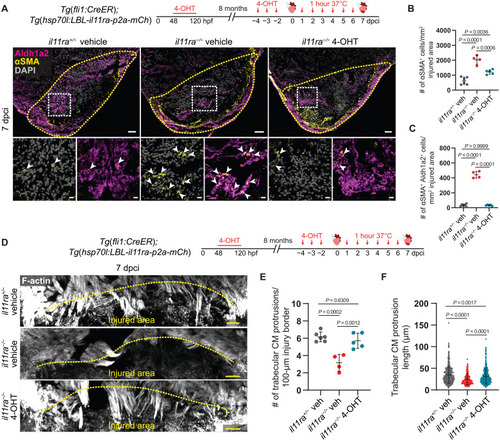
Il-11 signaling in endothelial cells allows CM repopulation after cardiac injury. (A) Experimental design and confocal images of immunostaining (Aldh1a2, magenta; ?SMA, yellow) on cryosections from vehicle-treated il11ra+/? siblings (n = 6) and vehicle- or 4-OHT?treated il11ra?/? (n = 4 and 5, respectively) Tg(fli1:CreER); Tg(hsp70l:LBL-il11ra-p2a-mCh) ventricles at 7 dpci. (B and C) Quantification of total ?SMA+ cell density (B) and ?SMA+ Aldh1a2+ cell density (C) in the injured area, 7 dpci. (D) Experimental design and F-actin staining on 50-?m-thick cryosections from vehicle-treated il11ra+/? siblings and vehicle- or 4-OHT?treated il11ra?/? Tg(fli1:CreER); Tg(hsp70l:LBL-il11ra-p2a-mCh) ventricles at 7 dpci. (E and F) Quantification of the number per ventricle (E) (il11ra+/? veh, n = 6; il11ra?/? veh, n = 4; il11ra?/? 4-OHT, n = 5) and length (F) (il11ra+/? veh, n = 481; il11ra?/? veh, n = 185; il11ra?/? 4-OHT, n = 437) of CM protrusions at 7 dpci. Data represent means ± SD (B, C, E, and F). One-way ANOVA (B, C, and E); Kruskal-Wallis test (F). n, ventricles (A and E); n, CM protrusions (F). Yellow dashed lines demarcate the injured area (A and D); white arrowheads point to ?SMA+ Aldh1a2+ endocardial cells (A, insets). Scale bars, 50 ?m (A and D) and 10 ?m (A, insets).
|
Expression Data
| Antibodies: | |
|---|---|
| Fish: | |
| Conditions: | |
| Anatomical Terms: | |
| Stage: | Adult |
Expression Detail
Antibody Labeling
Phenotype Data
| Fish: | |
|---|---|
| Conditions: | |
| Observed In: | |
| Stage: | Adult |
Phenotype Detail
Acknowledgments
This image is the copyrighted work of the attributed author or publisher, and
ZFIN has permission only to display this image to its users.
Additional permissions should be obtained from the applicable author or publisher of the image.
Full text @ Sci Adv

