
Fig. 2
- ID
- ZDB-FIG-220131-76
- Publication
- Kozol et al., 2021 - Restoring Shank3 in the rostral brainstem of shank3ab-/- zebrafish autism models rescues sensory deficits
- Other Figures
- All Figure Page
- Back to All Figure Page
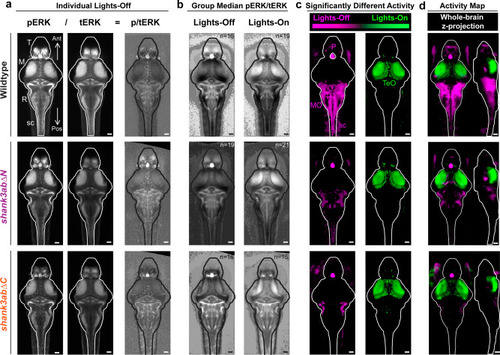
Brain-wide activity maps were generated by using phosphorylated-ERK (pERK) antibody staining as a proxy for neuronal activity. a Individual larval stacks were registered for use with the Z-brain atlas and MAP-mapping MATLAB scripts (Randlett et al. 12, Engert lab) Individual pERK stacks left were then divided by total-ERK (tERK; middle), providing normalized pERK/tERK signal (right). b Median p/tERK values were then calculated for every voxel within the brain for each genotype and light condition (Exact sample sizes of biologically independent samples for each condition and genotype (n = lights-on/lights-off); wild-type (n = 16/19), shank3ab?N (n = 19/21) and shank3ab?C (n = 16/15) are indicated on group median images in (b) and also apply to (c) and (d). c Mann?Whitney U z-scores were calculated, comparing lights-off and lights-on, with magenta indicating increased activity during the transition to lights-off (e.g. Medulla Oblongata, MO) and green indicating increased activity during the transition to lights-on (e.g. Optic Tectum, TeO). Regions within the brain that are black did not reach the P < 10?5 cut-off. d In comparison to wild-type, shank3ab??/? mutant models respond to the lights-off condition (magenta) with activation of their pineal (P), but fail to show activation in the MO and spinal cord (sc). a?c All images are 20 �m dorsal z-projections. d Whole brain z- and x-projections. Scale bars = 50 �m. |