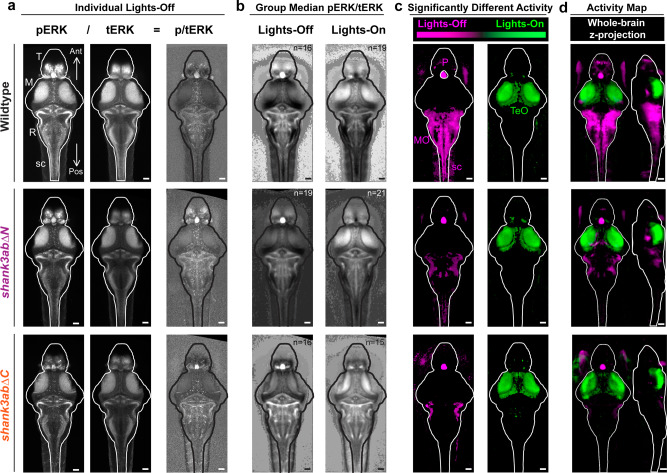
Fig. 2 Brain-wide activity maps were generated by using phosphorylated-ERK (pERK) antibody staining as a proxy for neuronal activity. a Individual larval stacks were registered for use with the Z-brain atlas and MAP-mapping MATLAB scripts (Randlett et al. 12, Engert lab) Individual pERK stacks left were then divided by total-ERK (tERK; middle), providing normalized pERK/tERK signal (right). b Median p/tERK values were then calculated for every voxel within the brain for each genotype and light condition (Exact sample sizes of biologically independent samples for each condition and genotype (n = lights-on/lights-off); wild-type (n = 16/19), shank3ab?N (n = 19/21) and shank3ab?C (n = 16/15) are indicated on group median images in (b) and also apply to (c) and (d). c Mann?Whitney U z-scores were calculated, comparing lights-off and lights-on, with magenta indicating increased activity during the transition to lights-off (e.g. Medulla Oblongata, MO) and green indicating increased activity during the transition to lights-on (e.g. Optic Tectum, TeO). Regions within the brain that are black did not reach the P < 10?5 cut-off. d In comparison to wild-type, shank3ab??/? mutant models respond to the lights-off condition (magenta) with activation of their pineal (P), but fail to show activation in the MO and spinal cord (sc). a?c All images are 20 Ám dorsal z-projections. d Whole brain z- and x-projections. Scale bars = 50 Ám.
Image
Figure Caption
Acknowledgments
This image is the copyrighted work of the attributed author or publisher, and
ZFIN has permission only to display this image to its users.
Additional permissions should be obtained from the applicable author or publisher of the image.
Full text @ Commun Biol

