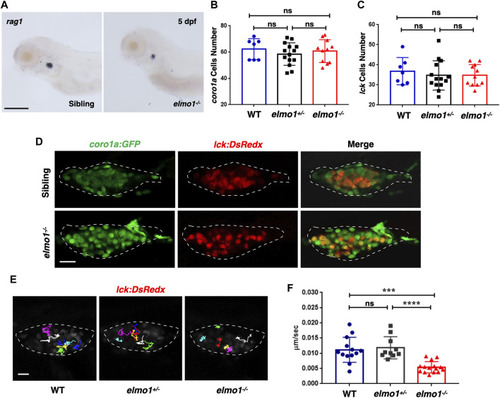
T-cell motility in the thymus was reduced at the larval stage of the elmo1 mutant. (A) rag1 WISH data indicate a T-cell defect in the elmo1?/? larvae at 5 dpf. Scale bar: 200 ?m. (B, C) Quantification of coro1a:GFP positive cells (B) represents whole leukocytes and lck:DsRedx positive (C) cells represent T-cells within the thymus in the wild-type (WT), elmo1+/?, elmo1?/? larvae respectively. There was no significance between them. One-way ANOVA, ns: no significance. (D) Fluorescence images show that coro1a:GFP represent whole leukocytes and lck:DsRedx represent T-cells show no significance between the siblings and elmo1?/? larvae in the thymus at 5 dpf. The white dotted region indicates the thymus in the image. Scale bar: 10 ?m. (E) Track path of lck:DsRedx labeled T-cells of the WT, elmo1+/? and elmo1?/? larvae recorded by live imaging at 5 dpf. The white dotted region indicates the thymus. Each line represents the migration path of one T-cell. Scale bar: 10 ?m. (F) Quantification of T-cells migration speed in live imaging of the WT (13 cells of 4 larvae), elmo1+/? (10 cells of 4 larvae) and elmo1?/? (15 cells of 5 larvae) larvae in the thymus at 5 dpf. The migration speed of T-cells dramatically decreased in the elmo1?/? larvae. Each dot represents the average speed of one T-cell. Three independent experiments were performed. One-way ANOVA, ns: no significance, ***p < 0.005, ****p < 0.001.
|
