
Figure 6
- ID
- ZDB-FIG-220131-125
- Publication
- Bu et al., 2021 - Inhibition of mTOR or MAPK ameliorates vmhcl/myh7 cardiomyopathy in zebrafish
- Other Figures
- All Figure Page
- Back to All Figure Page
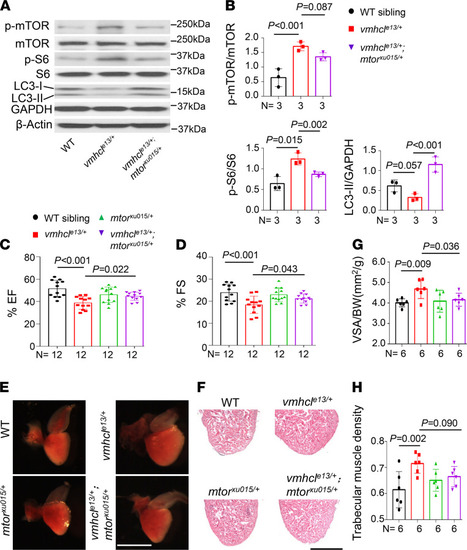
Therapeutic effects of mtor inhibition on the VAC model.
(A and B) Representative Western blots showing the levels of proteins involved in mTOR signaling pathways in WT controls, vmhcle13/+, and vmhcle13/+mtorxu015/+ mutants and quantification analysis. n = 3 biological replicates; data are presented as the mean � SD; 1-way ANOVA. (C and D) Quantification of the percent EF and FS using echocardiography in fish at 8 months. n = 12; data are presented as the mean � SD; 1-way ANOVA. (E and F) Representative images of isolated hearts and H&E staining in the apex area in fish at 8 months. (G and H) Quantification of the VSA normalized to BW and trabecular muscle density in these mutants and WT controls at 8 months. n = 6; data are presented as the mean � SD; 1-way ANOVA. Scale bars: 2 mm in E and 300 ?m in F. |
| Antibodies: | |
|---|---|
| Fish: | |
| Anatomical Term: | |
| Stage: | Adult |
| Fish: | |
|---|---|
| Observed In: | |
| Stage: | Adult |