
Figure 4
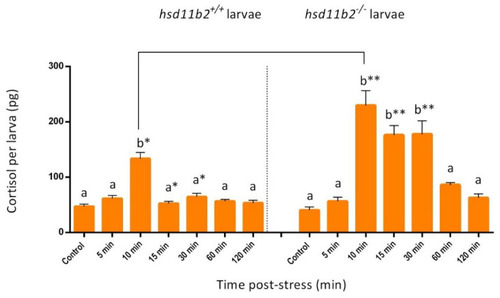
Effect of acute stress application on whole-body cortisol concentrations of individual larvae at 5 dpf, as depicted by bar graphs. Measurements of 10 individual hsd11b2+/+ (WT) and 10 individual hsd11b2?/? (mutant larvae) was performed prior to (control) and 5, 10, 15, 30, 60 and 120 min after the stress application. Values are means � SEM. Means with different letters differ significantly from one another (p < 0.001). Asterisks show statistically significant differences between the two groups (p < 0.001). Holm-Sidak comparison test was applied to identify groups that were significantly different. * p < 0.05, ** p < 0.01. Data for the two different genotypes are separated by the dot line in the graph. |
| Fish: | |
|---|---|
| Condition: | |
| Observed In: | |
| Stage: | Day 5 |