
FIGURE
Figure 3
Figure 3
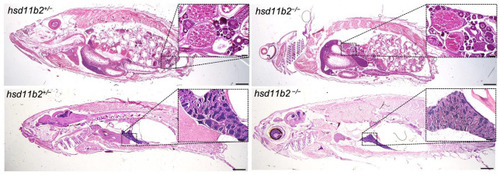
Histological analysis of 8-mpf female (top panels) and males (bottom panels) hsd11b2+/? and hsd11b2?/? zebrafish (scale bar = 1 mm). Magnification of ovaries (top panels) and testis (bottom panels) (scale bar = 100 um). |
Expression Data
Expression Detail
Antibody Labeling
Phenotype Data
| Fish: | |
|---|---|
| Observed In: | |
| Stage: | Adult |
Phenotype Detail
Acknowledgments
This image is the copyrighted work of the attributed author or publisher, and
ZFIN has permission only to display this image to its users.
Additional permissions should be obtained from the applicable author or publisher of the image.
Full text @ Int. J. Mol. Sci.