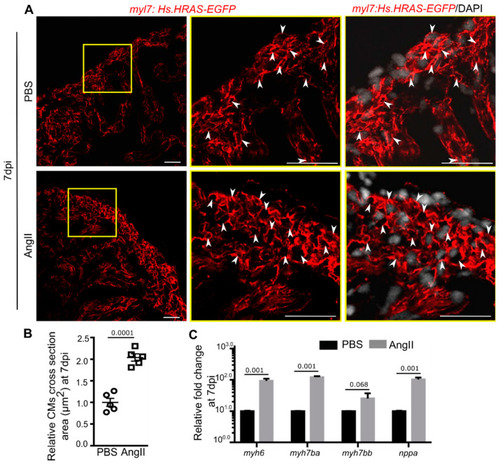
Angiotensin II induces cardiomyocyte hypertrophy in adult zebrafish. (A) Confocal optical sections of transverse cryosections of hearts isolated from PBS or AngII injected animals expressing EGFP in CM plasma membrane (red) and stained with DAPI (white; marks all nuclei). White arrowheads point to the plasma membrane of cross-sectioned CMs. (B) The dot plot represents the relative cross-sectional area of CMs at 7 dpi (n = 5 each from two independent experiments). At least 50 CMs from each section and 2 sections from each heart were included in the analysis. The mean of the cross-sectional area of CMs from PBS injected hearts was set to 1. (C) Quantitative analysis of the expression of hypertrophy marker genes in cardiac ventricles from PBS or AngII injected animals at 7 dpi (n = 3, each sample represents a pool of 6 hearts). Error bars indicate the mean � s.e.m. values in C were normalized to the mean of PBS control. Dpi: days post-injection. Significant, p < 0.05; non-significant, p ? 0.05. Scale: 20 �m.
|
