|
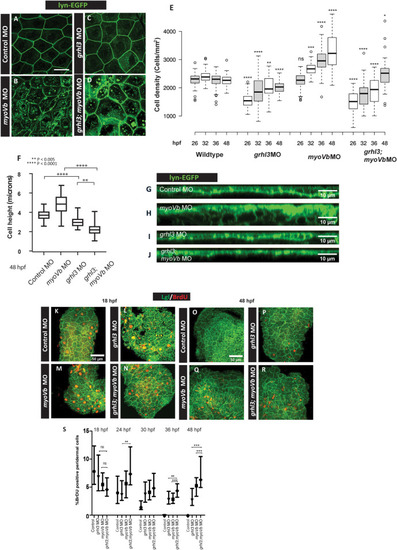
Cell loss due to Grhl3 deficiency leads to altered tissue architecture and homeostasis.Representative confocal images of cldnB:lynEGFP embryos (A-D), injected with control MO, myoVb MO, grhl3 MO, and grhl3 MO; myoVb MO. Peridermal cell density (cells/mm2) at different time-points in given genetic conditions (E). Note that grhl3 morphants as well as grhl3;myoVb morphants show lower cell density than wildtype at 26 hpf. However, their cell densities approach wild-type levels by 48 hpf. In myoVb morphants, cell density increases over time and is significantly higher than that in wild-type. Scale bar = 50 μm. Asterisks indicate statistically significant difference between the wild type and the given genetic condition at a comparable time-point by Kruskal Wallis one-way ANOVA followed by Dunn’s post-hoc test. Quantification of cell height (F) of peridermal cells at 48 hpf in four genetic conditions mentioned. grhl3 morphants and grhl3;myoVb double morphants show significantly reduced cell heights compared to those in control morphants and myoVb morphants, respectively (Kruskal Wallis one-way ANOVA, p<0.05). Orthogonal projections of confocal-scans showing cross-sectional view of periderm (G, H, I, J). Confocal micrographs of embryonic epidermis immunostained for Lgl/BrdU (K-R) at 18hpf (K-N) and 48hpf (O-R). Quantification of cell proliferation in the periderm at 18hpf, 4hpf, 30hpf,36hpf, and 48hpf in four genetic conditions (S). (All data presented as box plot showing median and IQR, One-way ANOVA with Tukey’s test, p < 0.05). In E, F and S square brackets denote comparisons while asterisks indicate statistically significant difference. Only relevant comparisons are shown. For all one-to-one comparisons, please refer to S2 Data.
|