
Figure 8
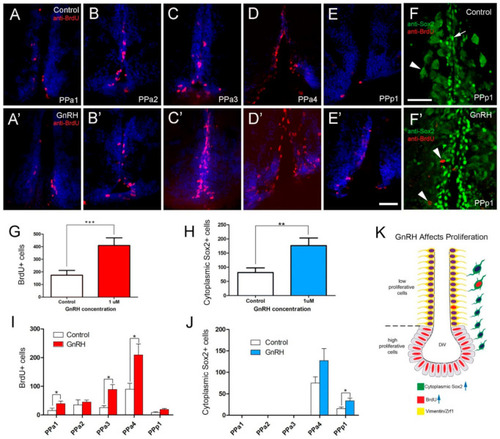
BrdU labeling reveals GnRH-induced increases in cells in the POA. (A?E,A??E?) Quantification of the effects of GnRH (1 �M GnRH) on the POA of adult zebrafish: Cells were counted in transverse 20 �m cryosections of the POA (12 sections). (A?E) GnRH control. (A?E?) GnRH treatment (1 �M GnRH). (F) Control with Sox2+ cells (arrow), cytoplasmic Sox2+ (arrowhead) (F?) GnRH treatment increased cytoplasmic Sox2+ cells in the PPp1 (arrowheads). (G) Significant increases in BrdU labeled cells in the GnRH-treated animals. (H) Significant increases in cytoplasmic Sox2+ cells increased in the GnRH-treated animals. *** p < 0.001; ** p < 0.01; Student?s t-test, SEM. (I,J) Number of cells located in the regions of the POA scored in transverse cryosections (20 �m: PPa1 = 2, PPa2 = 2, PPa3 = 3, PPa4 = 4 and PPp1 = 2). (I) Number of BrdU+ cells (J) number of cytoplasmic Sox2+ cells in GnRH-treated animals. * p < 0.05, Student?s t-test, SEM. (K) GnRH treatment increased the number of BrdU+ cells (blue arrow) and cytoplasmic Sox2+ (blue arrow) cells, where few cytoplasmic Sox2+ were also BrdU+. (A?E,A??E?): Sections labeled with DAPI (blue). Scale bars: 30 ?m. |