|
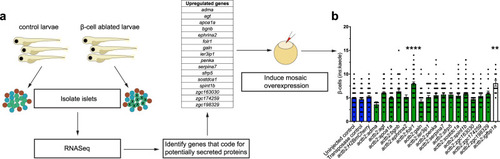
Genetic screen identifies <italic>folr1</italic> as an inducer of β-cell regeneration in zebrafish.a Schematic showing the experimental design of the genetic screen for inducers of β-cell regeneration. Briefly, primary islets were isolated from zebrafish larvae directly after β-cell ablation. RNA was extracted, and RNA-Seq was performed. Then, using the signalP algorithm, we identified the proteins with a signal peptide mediating secretion and cloned them under the control of the actb2 promoter. The constructs were injected into 1-cell-stage embryos to induce mosaic overexpression, and the number of regenerating β-cells was quantified two days after β-cell ablation. b Results of the genetic screen for inducers of β-cell regeneration. Blue bars depict three different negative controls of the regeneration assay, green bars show the tested proteins and the white bar shows the regenerating β-cells for the positive control igfbp1a. Data for the negative controls were pooled from 4 independent experiments. If there was an observed increase in β-cell regeneration in the first experiment, constructs were retested a second time, and the data shown in the graph were pooled from both independent replicates. The Kruskal–Wallis test followed by Dunn’s multiple comparison test was performed. n = 137 (uninjected control), n = 108 (transposase control), n = 83 (actb2:H2BmCherry), n = 10 (actb2:adma), n = 42 (actb2:agt), n = 57 (actb2:apoa1a), n = 37 (actb2:bgnb), n = 26 (actb2:ephrina2), n = 38 (actb2:folr1), n = 39 (actb2:galn), n = 24 (actb2:ier3ip1), n = 58 (actb2:penka), n = 26 (actb2:serpina7), n = 12 (actb2:sfrp5), n = 54 (actb2:sostdc1a), n = 63 (actb2:spint1b), n = 62 (actb2:zgc:163030), n = 26 (actb2:zgc:174259), n = 16 (actb2:zgc:198329) and n = 12 (actb2:igfbp1a) biologically independent zebrafish larvae were used for the quantification of β-cells. ****P < 0.001, **P = 0.0061 compared to uninjected control. Data are presented as mean values ± SEM.
|