|
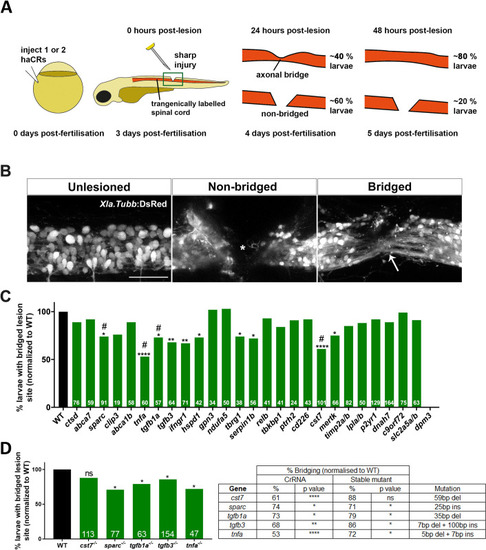
Phenotypic screening reveals modifiers of spinal cord regeneration.A: A schematic representation of the spinal cord regeneration assay. Percentages indicate expected proportions of larvae with an injury site bridged by axons in controls. B: Example images of unlesioned, non-bridged (star indicates gap of neuronal labeling) and bridged spinal cord (white arrow) are shown (lateral views). Scale bar = 50 μm. C: Results of spinal cord regeneration screen for all screened genes at 48 hpl are shown. Significant reductions in bridging, normalised to control lesioned animals, are observed for cst7 (p < 0.0001), sparc (p = 0.04), tgfb1a (p = 0.03), tgfb3 (p = 0.005), tnfa (p < 0.0001), ifngr1 (p = 0.0013,) hspd1 (p = 0.011), tbrg1 (p = 0.0494, serpinb1 (p = 0.0279), and mertk (p = 0.0195); * indicates significance at 48 hpl; # indicates significance at 24 hpl (see S2 Fig); number of larvae per experiment are indicated at the bottom of each bar. For dpm3 no viable larvae could be raised. A single sCrRNA targeting a key functional domain was used to target ctsd, abca7, sparc, clip3, abca1b, tnfa, tgfb1a and tgfb3. Two sCrRNAs were used to target all remaining genes. D: Mutant analysis confirms axonal phenotypes for sparc (p = 0.0189), tgfb1a (p = 0.019), tgfb3 (p = 0.043) and tnfa (p = 0.024), but not for cst7 (p = 0.079) at 48 hpl. The table compares the magnitude of effects between acute injection and in mutants. Fischer’s exact test was used for all analyses.
|