Fig. 1
- ID
- ZDB-FIG-210407-22
- Publication
- Fernandes et al., 2020 - Neural circuitry for stimulus selection in the zebrafish visual system
- Other Figures
- All Figure Page
- Back to All Figure Page
|
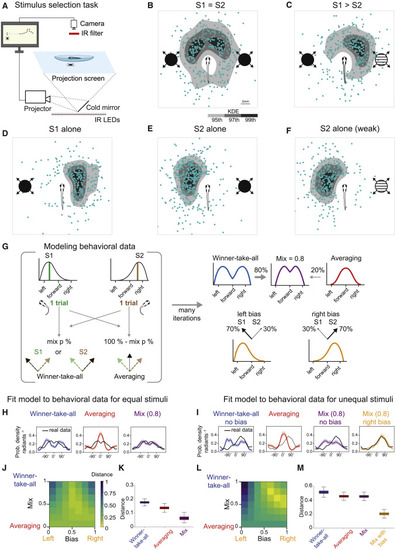
(A) Schematic of the stimulus selection task. The animal is tracked while updating, in real time, the positions of the looming disks projected from below. (B) Presentation of equal stimuli (S1 = S2, 90°/s). Blue dots are XY positions of fish after escape. In grayscale are kernel density estimation (KDE) isocontours of the same data. Fish schematics are enlarged for clarity. (C) Competition between unequal stimuli (S1 > S2, 90°/s versus 60°/s). (D) Response to a single looming stimulus (S1 alone, 90°/s) presented on the left side of the fish. (E) Same stimulus presented to the right side of the fish. (F) Weaker stimulus (S2, 60°/s) presented on the right side. (G) Implementation of a WTA, averaging, and mixed strategy models to explain observed behavioral data. Mix adjusts the amount of WTA relative to averaging. Bias adjusts the probability of response for S1 versus S2 to accommodate unequal stimuli. A bias parameter equal to 0.5 corresponds to no bias left or right (50% chance of a fish selecting either of two looming stimuli). (H) Modeling of behavior for equal stimulus competition. Shaded areas are 95% confidence intervals (CIs). (I) Similar to (H) but for unequal stimuli. (J) Behavior reconstruction goodness of fit. Heatmap showing the normalized energy distance between model and real data (related to H) depending on the model parameters (bias and mix). (K) Boxplot quantification of model energy distance to the real data using resampling statistics. Permutation test p values that the mix model outperforms the simpler models are as follows: WTA, 0.0001; averaging, 0.008. For details, see STAR methods. (L) Similar to (J) but for unequal stimuli. (M) Similar to (K) but for unequal stimuli. Permutation test p values that the mix bias model outperforms the simpler models are p < 0.001 (WTA), p < 0.001 (averaging), and p < 0.001 (mix model). n = 117 fish. |

