- Title
-
Neural circuitry for stimulus selection in the zebrafish visual system
- Authors
- Fernandes, A.M., Mearns, D.S., Donovan, J.C., Larsch, J., Helmbrecht, T.O., Kölsch, Y., Laurell, E., Kawakami, K., Dal Maschio, M., Baier, H.
- Source
- Full text @ Neuron
|
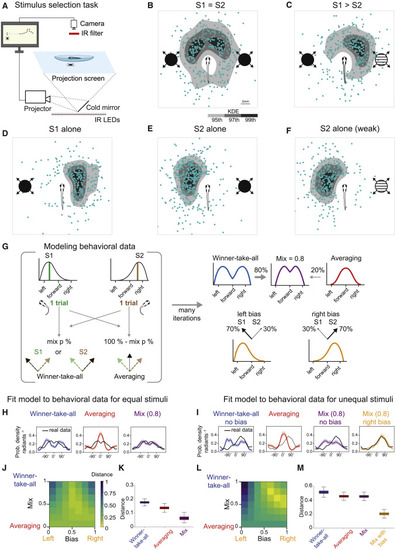
(A) Schematic of the stimulus selection task. The animal is tracked while updating, in real time, the positions of the looming disks projected from below. (B) Presentation of equal stimuli (S1 = S2, 90°/s). Blue dots are XY positions of fish after escape. In grayscale are kernel density estimation (KDE) isocontours of the same data. Fish schematics are enlarged for clarity. (C) Competition between unequal stimuli (S1 > S2, 90°/s versus 60°/s). (D) Response to a single looming stimulus (S1 alone, 90°/s) presented on the left side of the fish. (E) Same stimulus presented to the right side of the fish. (F) Weaker stimulus (S2, 60°/s) presented on the right side. (G) Implementation of a WTA, averaging, and mixed strategy models to explain observed behavioral data. Mix adjusts the amount of WTA relative to averaging. Bias adjusts the probability of response for S1 versus S2 to accommodate unequal stimuli. A bias parameter equal to 0.5 corresponds to no bias left or right (50% chance of a fish selecting either of two looming stimuli). (H) Modeling of behavior for equal stimulus competition. Shaded areas are 95% confidence intervals (CIs). (I) Similar to (H) but for unequal stimuli. (J) Behavior reconstruction goodness of fit. Heatmap showing the normalized energy distance between model and real data (related to H) depending on the model parameters (bias and mix). (K) Boxplot quantification of model energy distance to the real data using resampling statistics. Permutation test p values that the mix model outperforms the simpler models are as follows: WTA, 0.0001; averaging, 0.008. For details, see STAR methods. (L) Similar to (J) but for unequal stimuli. (M) Similar to (K) but for unequal stimuli. Permutation test p values that the mix bias model outperforms the simpler models are p < 0.001 (WTA), p < 0.001 (averaging), and p < 0.001 (mix model). n = 117 fish. |
|
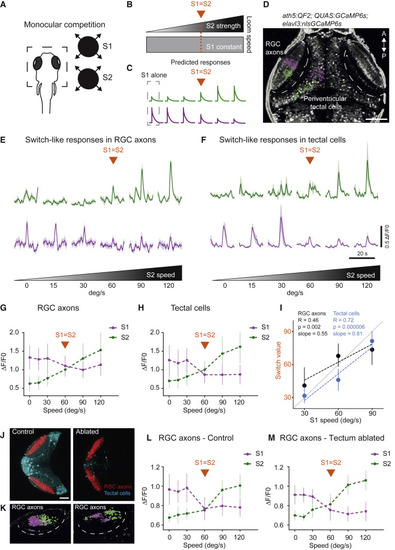
(A) Schematic of the calcium imaging experiment. Right: monocular competition task. S1, stimulus 1; S2, stimulus 2. (B) Schematic of the competition protocol. The orange line represents the condition with presentation of equal stimuli (switch value). (C) Predicted responses following a strategy resembling WTA. (D) Pixel-wise regression analysis of the temporal series during a single imaging trial. The corresponding t-statistic for each pixel is calculated (only pixels that passed a threshold using the 90th percentile are shown). Map shows associated S1-responsive pixels suppressed by a stronger S2 (magenta) and pixels with enhanced responses as a function of S2 strength (green). Scale bar, 50 ?m. (E) Characteristic activity profiles for RGCs. Top traces, average of 10 RGC axon regions of interest (ROIs) enhanced by S2 (in green). Lower traces, average of 10 RGC axon ROIs suppressed by a stronger S2 (in magenta). The orange arrow represents the condition with presentation of equal stimuli (switch value). (F) Similar to (E) but for tectal cells. (G) Summary plot across all conditions for RGC axon pixels. Switch-like responses, showing RGC pixels suppressed by S2, are shown in magenta. RGC pixels enhanced by S2 are shown in green. The S1 expansion rate is 60°/s. (H) Similar to (G) but for tectal pixels. (I) Switch value increases with S1 strength for RGC axons and tectal cells. The R value is the correlation coefficient. The p value relates to testing whether the slope is zero. n = 5 fish. (J) Chemogenetic ablation of tectal cells does not affect suppression observed in RGC axons. The genotype used were ath5:QF2, QUAS:GCaMP6s (red), SAGFF(LF)81C, and UAS:NTR-mCherry (cyan). Left: control fish. Right: ablated fish. Scale bar: 100 ?m. (K) Pixel-wise regression analysis of the temporal series during a single imaging trial. The corresponding t-statistic for each pixel is calculated as in (D). The map shows associated S1-responsive pixels suppressed by a stronger S2 (magenta) and pixels that enhance their responses as a function of S2 strength (green). Left panel: control fish. Right panel: ablated fish. (L) Summary plot across all conditions for RGC axon pixels. Switch-like responses, showing RGC pixels suppressed by S2, are shown in magenta. RGC pixels enhanced by S2 are shown in green. The S1 expansion rate is 60°/s. Control fish. n = 4 fish. (M) Similar to (L) but for ablated fish. n = 5 fish. Error bars indicate SD. |
|
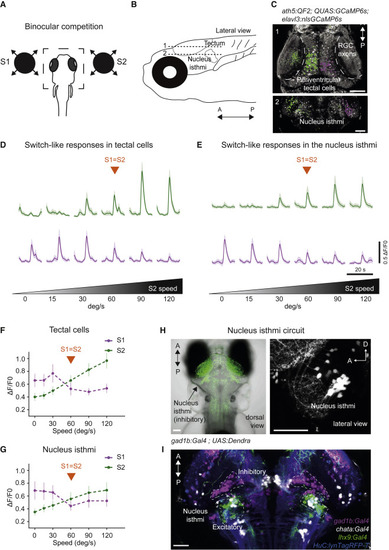
(A) Binocular competition task. (B) Anatomical location of the tectum (plane 1) and the NI (plane 2). (C) Pixel-wise regression analysis during a single imaging trial. The t-statistic for each pixel is calculated as in Figure 2D. Map 1 shows associated S1-responsive tectal pixels suppressed by a stronger S2 stimulus (in magenta). Pixels that enhance their response as a function of S2 intensity are shown in green. Map 2: similar to Map 1 but for the NI. Scale bars, 50 ?m. (D) Characteristic activity profiles for tectal cells. Top traces, average of 10 tectal ROIs enhanced by S2 (green). Lower traces, average of 10 tectal ROIs suppressed by a stronger S2 stimulus (magenta). (E) Similar to (D) but for NI. (F) Summary plot across all conditions for tectal pixels. Switch-like responses, showing pixels suppressed by S2, are shown in magenta. Pixels enhanced by S2 are shown in green. n = 5 fish. (G) Similar to (F) but for NI. n = 4 fish. Error bars indicate SD. (H) Dorsal image of a double-transgenic gad1b:Gal4VP16mpn155; UAS:Dendra-krass1998t fish, labeling GABAergic neurons in green. The arrow indicates the location of GABAergic NI neurons. Right panel, lateral view of gad1b:Gal4VP16mpn155; UAS:nfsb-mCherryc264 fish, labeling GABAergic neurons in white. (I) Alignment of several transgenic lines: gad1b:Gal4VP16mpn155 labeling GABAergic NI neurons (magenta), lhx9:Gal4VP16mpn203 labeling lhx9-positive NI neurons (green), and chata:Gal4VP16mpn202 labeling cholinergic NI neurons (white). elavl3:lyn-tagRFPmpn404 is used as a reference channel (blue). Scale bars, 50 ?m. |
|
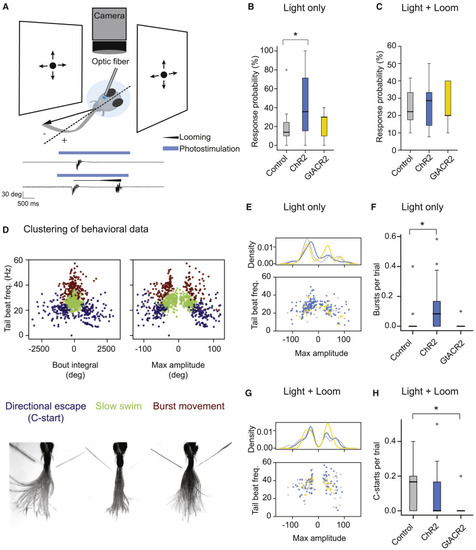
(A) Schematic of the optogenetics setup. A fish is embedded in agarose with the tail free. The tail is recorded with a camera. Equal looming stimuli are presented to both eyes simultaneously. NI is stimulated unilaterally with an optical fiber. Negative angles represent tail deflections toward the stimulated side, and positive angles represent tail deflections away from the stimulated side. Bottom: example trials from a fish expressing ChR2 in the NI. Shown are photostimulation only (top) and photostimulation with looms (bottom). Black traces show tail angle over time. The blue bar represents time of optogenetic stimulation. The black line above the tail trace triangle represents the duration of loom. (B) Probability that fish perform a swim bout in response to photostimulation under control (gray), ChR2+ (blue), and GtACR2+ (yellow) conditions. ChR2 and GtACR2 animals express ChR2-mCherry or GtACR2-YFP in excitatory lhx9-positive cells of the NI. Control animals express no optogenetic actuator. (C) Probability that fish perform a swim bout when simultaneously presented with looming stimuli to each eye and the NI is stimulated unilaterally. (D) Hierarchical clustering of swim bouts. Identified types are directional C-start escapes (blue), slow swims (green), and burst swims (red). Bottom: overlay of frames from representative bouts belonging to each of the three clusters. (E) Tail beat frequency plotted against maximum tail amplitude for light-evoked bouts across all conditions. Density indicates the KDE over the maximum amplitude. Bouts evoked in ChR2+ fish (blue) are of lower amplitude compared with controls (p = 0.043, Kolmogorov-Smirnov test). (F) Average number of burst swims evoked per trial in response to light stimulation across fish. (G) As in (E) except for bouts evoked by presentation of equal looms to the two eyes during optogenetic stimulation. Distributions are not significantly different between control and optogenetic conditions (p > 0.05, Kolmogorov-Smirnov test). (H) Average number of C-starts (WTA responses) evoked per trial in response to equal looms presented to the two eyes during simultaneous stimulation of the NI across fish. Control fish, n = 18; ChR2+, n = 21; GtACR2+, n = 9. |
|
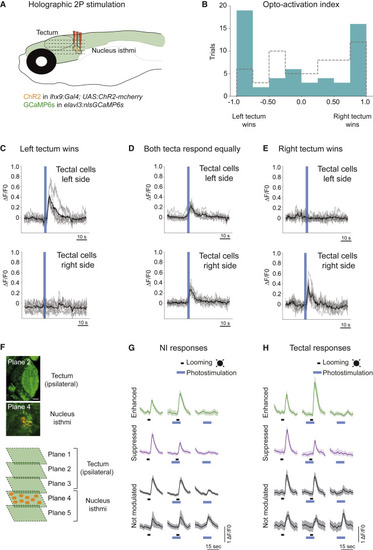
(A) Schematic of the holographic optogenetics experiment. (B) Opto-activation index. Unilateral optogenetic activation of lhx9-positive isthmic neurons (right side) leads to WTA and averaging activity in the tectum (in blue). The opto-activation index is calculated as follows: (responsive cells right tectum ? responsive cells left tectum) / (responsive cells right tectum + responsive cells left tectum). Opto-index distribution for the control condition (ChR2 negative fish) is shown in gray. Distributions are significantly different (p = 0.038, two-sided Kolmogorov-Smirnov test). (C) Example of 10 cells from each tectum in a trial where the left tectum ?won? (WTA). The black line shows mean response for all cells. Gray traces show individual cell activity. (D) Similar to (C) but for a trial where both tecta were equally active (averaging). (E) Similar to (C) and (D) but a trial where the right tectum ?won? (WTA). (F) Activation of specific lhx9-positive isthmic neurons expressing Channelrhodopsin (ChR2; orange), combined with volumetric imaging of ipsilateral tectal responses (GCaMP6s, green). Up to five planes, including the tectum and NI region, were recorded simultaneously. (G) Photostimulation of lhx9-positive isthmic neurons. Some of the isthmic looming-evoked responses are unaffected by optogenetic stimulation (in gray), whereas others are either suppressed (magenta) or enhanced (green). Examples of averages of 10 cells are shown for each response type. Shaded areas represent SD. (H) Similar to (G) but for tectal cells. |
|
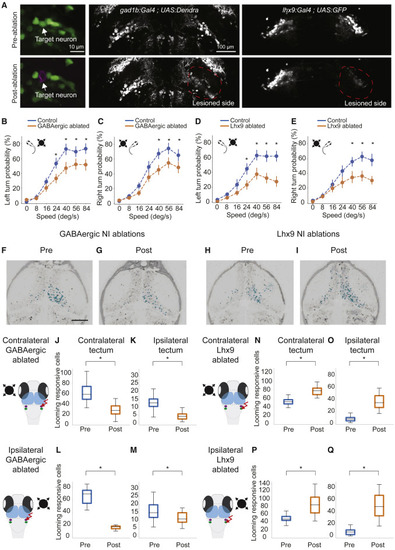
(A) 2P laser ablation of isthmic neurons. Shown is an example of single cell ablation (left panels). After ablation of a cell, red fluorescence (magenta) is visible in the target spot. The center panels show representative images of unilateral 2P laser ablation of GABAergic-positive isthmic neurons in gad1b:Gal4VP16mpn155; UAS:Dendra-krass1998t pre-ablation and post-ablation. Right panels: ablation of glutamatergic isthmic neurons in lhx9:Gal4VP16mpn203; UAS:EGFP pre-ablation and post-ablation. (B) Probability of left escapes in control (blue) and GABAergic NI-ablated fish (orange). (C) Similar to (B) but for right escapes. (D) Probability of left escapes in control (blue) and lhx9 NI-ablated fish (orange). (E) Similar to (D) but for right escapes. For all looming-evoked escape panels, error bars represent SD. n = 12 for control fish (blue). n = 15 for ablated fish (orange). ?p < 0.05, Tukey?s honestly significant difference (HSD) test. (F and G) Example of the effect of unilateral ablation of the GABAergic-positive NI on the right hemisphere. (F) is before ablation and (G) is after ablation. The corresponding t-statistic for each pixel is calculated for looming-responsive cells and labeled in cyan. (H and I) Example of the effect of unilateral ablation of the lhx9-positive NI on the right hemisphere before (H) and after (I) ablation. (J) Number of looming-responsive cells in the contralateral (relative to looming stimulus) tectum before and after ablation of GABAergic-positive NI cells in the right hemisphere. n = 4. (K) Number of looming-responsive cells in the ipsilateral (relative to looming stimulus) tectum. (L) Number of looming responsive cells in the contralateral tectum (relative to looming stimulus) for the intact hemisphere before and after ablation of GABAergic-positive NI cells in the right hemisphere. N = 2. (M) Number of looming-responsive cells in the ipsilateral tectum (relative to looming stimulus) for the intact hemisphere after ablation of the GABAergic-positive NI. (N) Number of looming-responsive cells in the contralateral (relative to looming stimulus) tectum before and after ablation of lhx9-positive NI cells in the right hemisphere. n = 3 fish. (O) Number of looming-responsive cells in the ipsilateral (relative to looming stimulus) tectum. (P) Number of looming-responsive cells in the contralateral tectum (relative to looming stimulus) for the intact hemisphere before and after ablation of lhx9-positive NI cells in the right hemisphere. n = 2 fish. (Q) Number of looming-responsive cells in the ipsilateral tectum (relative to looming stimulus) for the intact hemisphere after ablation of lhx9-positive NI cells. For all panels, ?p < 0.05, Mann-Whitney U test. |
|
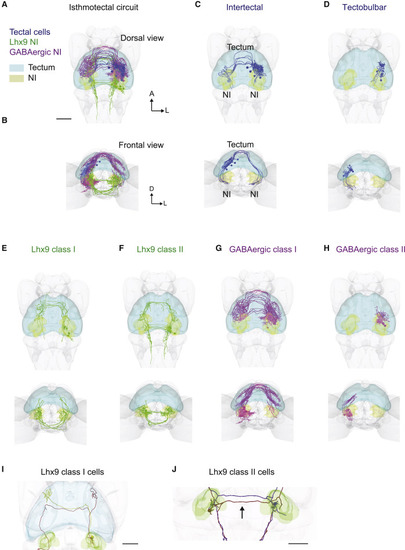
(A) Cellular-resolution atlas of isthmotectal circuitry showing single-cell reconstructions. Shown are tectal cells in blue, lhx9-positive NI cells in green, and GABAergic-positive NI cells in magenta, dorsal view, and masks for the tectum and NI (light blue and yellow, respectively). (B) Same as (A) but frontal view. (C) Intertectal cells with a bifurcated axon, terminating in the vicinity of the NI on both sides. (D) Tectobulbar neurons targeting the ipsilateral NI. (E) Lhx9-positive NI cells (class I) projecting first to the ipsilateral tectum and then to the contralateral tectum. (F) Lhx9-positive NI cells (class II) projecting first to the contralateral NI, close to the contralateral tectum, and then to the ipsilateral tectum. (G) GABAergic-positive NI cells (class I) projecting first to the ipsilateral tectum and then to the contralateral tectum. (H) GABAergic-positive NI cells (class II) projecting only to the ipsilateral tectum. For each morphological type, dorsal and frontal views are shown. (I) Example of two Lhx9 class I cells with projections to the tectum. Both cell bodies are on the right. The brown cell shows terminations mainly in the ipsilateral tectum, whereas the green cell shows termination mainly in the contralateral tectum. (J) Example of reciprocal projections of two Lhx9 class II NI cells. The red cell has its soma in the left NI and terminations in the right NI. The purple cell has its soma in the right NI and terminations in the left NI. Both cells have descending projections to the hindbrain. Scale bars, 50 ?m. |
|
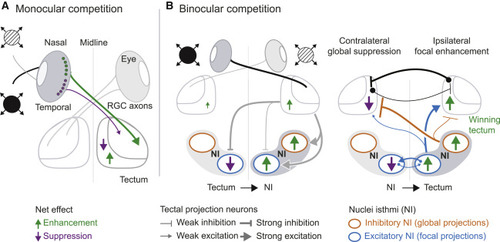
(A) Schematized summary of findings for monocular competition. The most salient stimulus ?wins? in the retina through reciprocal inhibition, possibly mediated by amacrine cells. Saliency tuning is sharpened by a tectum-intrinsic circuit. (B) Circuit model for binocular competition. Each tectum drives activity in the ipsilateral NI (putative excitatory tectobulbar neurons) and suppresses activity in the contralateral NI (putative inhibitory intertectal neurons). Focal enhancement, mediated by excitatory NI cells, is stronger on the ?winning? stimulus side (green arrows). Suppression, mediated by globally projecting inhibitory NI neurons, is stronger on the ?losing? stimulus side (magenta arrows). Reciprocal isthmotectal loops ensure focal enhancement of responses to a stronger stimulus and suppression of responses to a weaker stimulus, implementing a WTA computation. Black connections across both tecta represent putative inhibitory commissural neurons projecting to the contralateral side. Equal activity in both NIs may result in neither tectum winning and an averaging strategy being implemented instead. |

