
FIGURE
Figure 3
- ID
- ZDB-FIG-210310-107
- Publication
- Zizioli et al., 2021 - Development of BCR-ABL1 Transgenic Zebrafish Model Reproducing Chronic Myeloid Leukemia (CML) Like-Disease and Providing a New Insight into CML Mechanisms
- Other Figures
- All Figure Page
- Back to All Figure Page
Figure 3
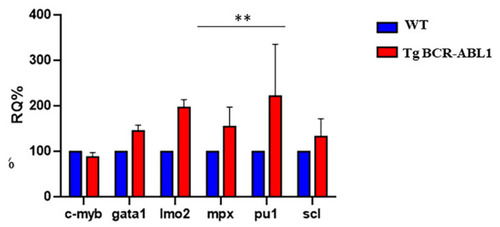
Expression level analysis of hematopoiesis markers. RT-PCR for transcript quantification of six known genes involved in hematopoiesis process. Gene expression was normalized using α elongation factor1 as a reference gene and expressed as relative quantification (RQ). Blue bars represent wild type; red bars represent Tg BCR-ABL1. Statistical analysis was performed by unpaired |
Expression Data
| Genes: | |
|---|---|
| Fish: | |
| Condition: | |
| Anatomical Term: | |
| Stage: | Prim-5 |
Expression Detail
Antibody Labeling
Phenotype Data
| Fish: | |
|---|---|
| Condition: | |
| Observed In: | |
| Stage: | Prim-5 |
Phenotype Detail
Acknowledgments
This image is the copyrighted work of the attributed author or publisher, and
ZFIN has permission only to display this image to its users.
Additional permissions should be obtained from the applicable author or publisher of the image.
Full text @ Cells