
Image
|
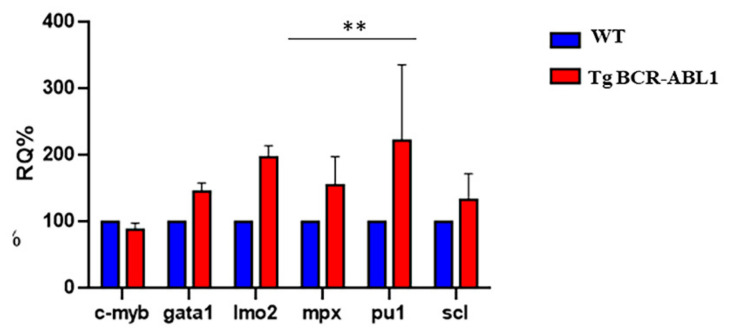
Figure Caption
Figure 3
Expression level analysis of hematopoiesis markers. RT-PCR for transcript quantification of six known genes involved in hematopoiesis process. Gene expression was normalized using α elongation factor1 as a reference gene and expressed as relative quantification (RQ). Blue bars represent wild type; red bars represent Tg BCR-ABL1. Statistical analysis was performed by unpaired
Figure Data
Acknowledgments
This image is the copyrighted work of the attributed author or publisher, and
ZFIN has permission only to display this image to its users.
Additional permissions should be obtained from the applicable author or publisher of the image.
Full text @ Cells