
Figure 1
- ID
- ZDB-FIG-210220-6
- Publication
- Howard et al., 2021 - An atlas of neural crest lineages along the posterior developing zebrafish at single-cell resolution
- Other Figures
-
- Figure 1
- Figure 1 - figure supplement 1
- Figure 1 - figure supplement 2
- Figure 1 - figure supplement 3
- Figure 1 - figure supplement 4
- Figure 1 - figure supplement 5
- Figure 2
- Figure 3
- Figure 3 - figure supplement 1
- Figure 4
- Figure 5
- Figure 5 - figure supplement 1
- Figure 5 - figure supplement 2
- Figure 6
- Figure 6 - figure supplement 1
- Figure 6 - figure supplement 2
- Figure 7
- Figure 7 - figure supplement 1
- All Figure Page
- Back to All Figure Page
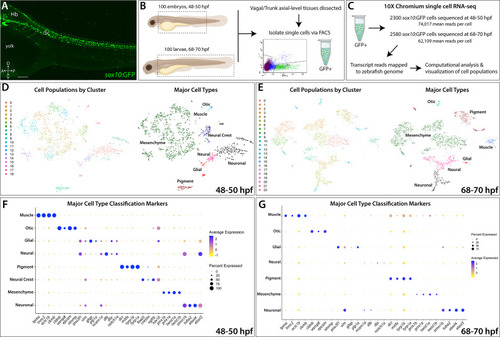
(A) Confocal image of a sox10:GFP+ embryo at 48 hpf; Hb: Hindbrain; Sc: Spinal cord. A: Anterior, P: Posterior, D: Dorsal, V: Ventral. Scale bar: 50 ?M (B) Cartoon illustrations of a zebrafish embryo at 48?50 hpf and an early larval fish at 68?70 hpf depicted laterally to summarize the dissection workflow used to collect posterior sox10:GFP+ cells. (C) Schematic of the 10X Genomics Chromium and data analysis pipeline. (D) tSNE plots showing the arrangement of Clusters 0?18 and where the major cell types identified among sox10:GFP+ cells arrange in the 48?50 hpf dataset. (E) tSNE plots showing the arrangement of Clusters 0?22 and where the major cell types identified among sox10:GFP+ cells arrange in the 68?70 hpf dataset. (F,G) Dot plots of the identifying gene markers for each major cell type classification in the 48?50 hpf and 68?70 hpf datasets, respectively. Dot size depicts the cell percentage for each marker within the dataset and the color summarizes the average expression levels for each gene. |