
Figure 7 - figure supplement 1
- ID
- ZDB-FIG-210220-23
- Publication
- Howard et al., 2021 - An atlas of neural crest lineages along the posterior developing zebrafish at single-cell resolution
- Other Figures
-
- Figure 1
- Figure 1 - figure supplement 1
- Figure 1 - figure supplement 2
- Figure 1 - figure supplement 3
- Figure 1 - figure supplement 4
- Figure 1 - figure supplement 5
- Figure 2
- Figure 3
- Figure 3 - figure supplement 1
- Figure 4
- Figure 5
- Figure 5 - figure supplement 1
- Figure 5 - figure supplement 2
- Figure 6
- Figure 6 - figure supplement 1
- Figure 6 - figure supplement 2
- Figure 7
- Figure 7 - figure supplement 1
- All Figure Page
- Back to All Figure Page
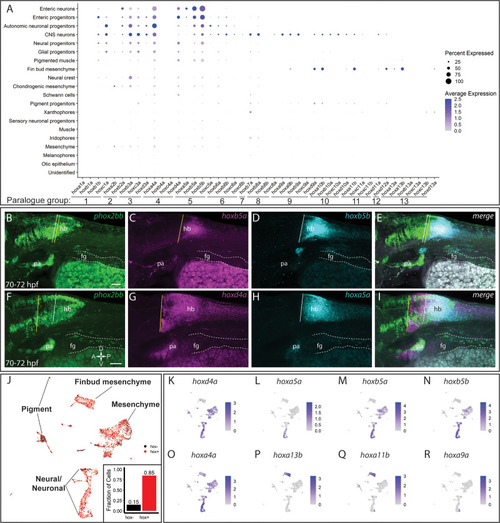
(A) Similar to Figure 7A,a comprehensive dot plot shows both the mean expression (color) as well as percent of cells per lineage (size) for zebrafish all hox genes. Discrete hox profiles discern specific cell types, which is particularly evident in the enteric neuronal cluster, as well as the fin bud mesenchyme. (B–I) Hindbrain expression patterns for enteric hox profiles. Autonomic neural marker phox2bb clearly marks the midbrain and hindbrain (hb) domains, as well as the pharyngeal arches (pa). Enterically fated cells can also clearly be seen along the tract of the gut (dash region), starting the foregut (fg). Anterior domains for hoxb5a (C), hoxb5b (D), hoxd4a (G), and hoxa5a (H) are represented by a vertical line. Overlapping regions can be approximated by the merged images (E, I). Scale in (B, F): 50 μm; dorsoventral-rostrocaudal axis defined in (F). (J) UMAP of the atlas demonstrating pervasive hox expression throughout the dataset. Expression was defined as having a log2 fold change >0. Approximately 85% of cells contained expression for at least one hox gene. (K–R) Feature plots representing the expression of selected hox genes within the atlas UMAP. hoxd4a (K), hoxa5a (L), hoxb5a (M), hoxb5b (N) all localize in varying degrees to the enteric neural signature, though hoxd4a also marks the mesenchymal clusters, as seen (A). hoxa4a (O) highlights its pervasive expression among the clusters. hoxa13b (P) and hoxa11b (Q) are key markers denoting the fin bud mesenchyme. Alternative neural populations are further identified by their hoxa9a (R) expression profile, contrasting with the enteric populations. |