
Fig. 8
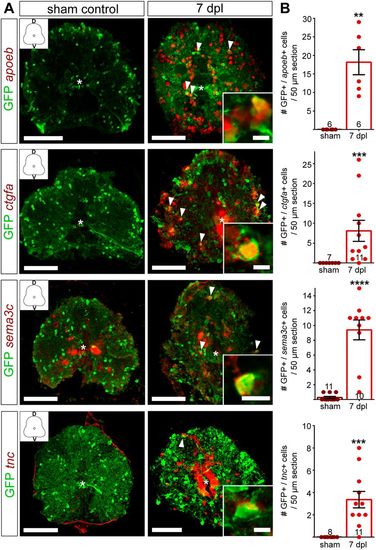
Validation of RNAseq candidate genes with fluorescent in situ hybridization. (A) Fluorescent in situ hybridization for apoeb, ctgfa, sema3c and tnc in Tg(olig2:eGFP) fish. SCI results in gene expression upregulation (red) in the spinal cord parenchyma (ctgfa, tnc, sema3c and apoeb) and in the central canal (ctgfa and tnc) at 7?dpl. Sections were co-stained using anti-GFP antibody. Overview images are maximum intensity projections of transverse sections. D, dorsal; V, ventral. In the overview images, a white asterisk indicates the central canal. Scale bars: 10??m in insets; 100??m in overviews. (B) Quantification of mRNA+/GFP+ cells in 50?�m sections, 350?�m rostral to the lesion site shows a significant increase in the number of OPCs upregulating the respective gene at 7?dpl, compared to sham controls. Data are mean�s.e.m. Numbers in the plots indicate the number of sections counted. Number of experimental animals were as follows: six sham control and six lesioned for apoeb, ctgfa and tnc; eight sham and eight lesioned for sema3c. **P?0.01; ***P?0.001; ****P<0.0001 (Mann?Whitney test). Significance is shown compared to sham control. |