
Fig. 3
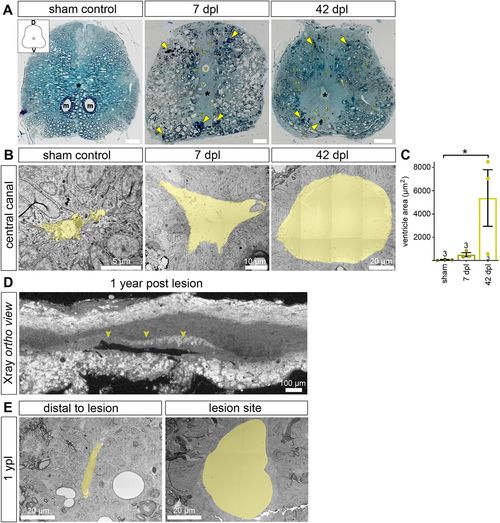
SCI results in altered tissue architecture close to the transection site that persists at 1?ypl. (A) Semi-thin transverse spinal cord sections stained with Toluidine Blue/borax to visualize membranes. Sections at 7?dpl and 42?dpl come from the rostral part of the lesion site, and ?50??m from the transection site. In the overview images, a black asterisk indicates the central canal (m, Mauthner axon; v, blood vessel). D, dorsal; V, ventral. At 7?dpl, myelin debris is indicated by yellow arrowheads. At 42?dpl, tissue integrity is largely restored, yet tissue architecture does not return to its pre-injury characteristics. Vessels and ventricular area remain markedly increased. Scale bars: 50?�m. (B,C) SCI results in an increase in the area of the central canal that persists at 42 dpl. Images are TEM close-ups of transverse spinal cord sections. The central canal is pseudo-coloured (yellow). Data are mean�s.e.m. Numbers in the plots indicate the number of experimental animals.*P?0.05 (Kruskal?Wallis followed by Dunn's multiple comparisons post-hoc test). Significance is shown compared to sham control. (D) X-ray microtomography (X?CT) to identify the lesion site at 1 ypl. Shown is an optical section of the orthogonal view after the scan was reconstructed as a TIFF stack. The position of the lesion site (including the transection site) was determined based on the size of the ventricle along the anterior-posterior axis of the spinal cord. (E) The area of the central canal at the lesion site remains increased at 1 ypl when compared with sites distal to the transected area (n=2). Images are TEM close-ups of transverse spinal cord sections. The central canal is pseudo-coloured (yellow). |