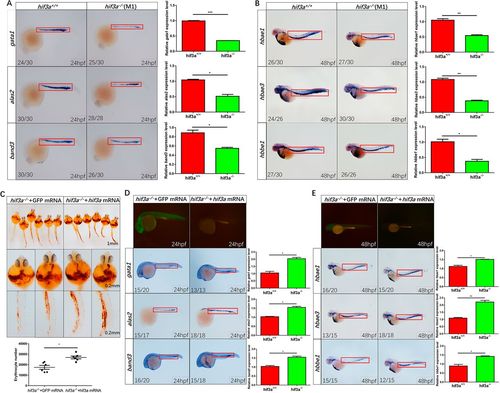
Disruption of hif3a influences expression of hematopoietic marker genes, but ectopic expression of hif3a partially rescues hematopoietic defects exhibited in hif3a?/?. (A) Expression levels of the erythrocytic markers gata1, alas2 and band3 were reduced significantly in hif3a?/? larvae at 24?hpf. Quantitation of the signal in the red rectangle is shown on the right (10 larvae for each, three replicates). (B) Expression levels of the erythrocyte-specific hemoglobin markers hbae1, hbae3 and hbbe1 were reduced in hif3a?/? larvae at 48?hpf. Quantitation of the signal in the red rectangle shown on the right (10 larvae for each, three replicates). (C) O-Dianisidine staining indicated that co-injection of hif3a mRNA partially restored hemoglobin levels in hif3a?/? larvae compared with co-injection of GFP mRNA at 36?hpf. Hif3a and GFP mRNA, 750?pg/embryo. Quantitation showed in the bottom panel (six larvae for each, three replicates). (D) Expression levels of the erythrocytic markers gata1, alas2 and band3 were restored by injection of hif3a mRNA in hif3a?/? embryos as compared to the injection of the GFP mRNA control at 24?hpf. Quantitation of the signal in the red rectangle is shown on the right (10 larvae for each, three replicates). (E) Expression levels of the erythrocytic markers hbae1, hbae3 and hbbe1, were restored by injection of hif3a mRNA in hif3a?/? embryos as compared to the injection of the GFP mRNA control at 48?hpf. Quantitation of the signal in the red rectangle is shown on the right (10 larvae for each, three replicates). The number of stained embryos is indicated in the left lower corner of each representative picture. M1, mutant 1. Error bars indicate the s.e.m.; *P<0.05; **P<0.01; ***P<0.001 (unpaired, two-tailed Student's t-test).
|
