
Figure 2—figure supplement 1.
- ID
- ZDB-FIG-201209-34
- Publication
- Segebarth et al., 2020 - On the objectivity, reliability, and validity of deep learning enabled bioimage analyses
- Other Figures
-
- Figure 1—figure supplement 1.
- Figure 1—figure supplement 1.
- Figure 1—figure supplement 2.
- Figure 2—figure supplement 1.
- Figure 2—figure supplement 1.
- Figure 2—figure supplement 2.
- Figure 2—figure supplement 3.
- Figure 2—figure supplement 4.
- Figure 3—figure supplement 1—source data 1.
- Figure 3—figure supplement 1—source data 1.
- Figure 4—source data 2.
- Figure 5—figure supplement 1.
- Figure 5—figure supplement 1.
- Figure 5—figure supplement 2.
- Figure 5—figure supplement 3.
- Figure 5—figure supplement 4.
- Figure 5—figure supplement 5.
- All Figure Page
- Back to All Figure Page
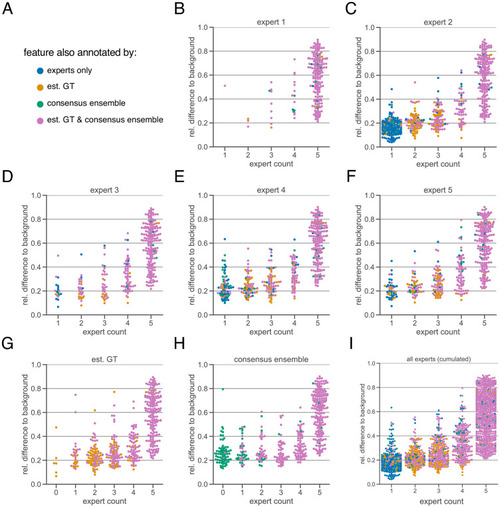
The subjectivity analysis depicts the relationship between the relative intensity difference of a florescent feature (ROI) to the background and the annotation count of human experts. A visual interpretation indicates that the annotation probability of a ROI is positively correlated with its relative relative intensity. The relative intensity difference is calculated as µinner–µouter/µinner where µinner is the mean signal intensity of the ROIs and µouter the mean signal intensity of its nearby outer area. We considered matching ROIs at an IoU threshold of t=0.5. The expert in the title of the respective plot was used to create the region proposals of the ROIs, that is, the annotations served as origin for the other pairwise comparisons. ( |