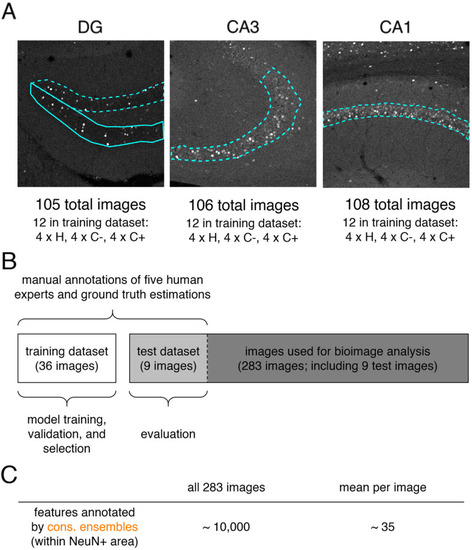
Figure 1—figure supplement 2.

Illustration of bioimage dataset Lab-Wue1.

(A) A total of 319 images showing cFOS immunoreactivity in the dorsal hippocampus of mice was split up in 105 images of the Dentate gyrus, 106 images of CA3 and 108 images of CA1. To create a balanced training dataset, four images of each experimental condition were randomly selected (H, C-, C+) from each hippocampal subregion (DG, CA3, CA1; 4 × 3 × 3 = 36 images). (B) Five expert neuroscientists (experts 1–5) manually annotated cFOS-positive nuclei in the selected 36 images of the training dataset and in nine additional images (test dataset). The test images represented one image per region and condition (3 × 3). Annotation was performed independently and on different computers and screens. The training dataset was used to train either expert specific models (only annotations of a single expert were used) or consensus models (est. GT annotations computed from the annotations of all five experts were used). Using k-fold cross-validation during the training, we were able to test the model performance and to ultimately select only those models that reached human level performance. The final evaluation of all models was then performed on the additional nine images of the test dataset. For bioimage analyses, we used the remaining 274 images and the nine test images. (C) On average, each consensus ensemble annotated ∼10,000 cFOS-positive feature within the NeuN-positive areas in all 283 images used for bioimage analysis, which is equivalent to ∼35 features per image.

Expression Data

Expression Detail
Antibody Labeling
Phenotype Data

Phenotype Detail
Acknowledgments
This image is the copyrighted work of the attributed author or publisher, and ZFIN has permission only to display this image to its users. Additional permissions should be obtained from the applicable author or publisher of the image. Full text @ Elife