|
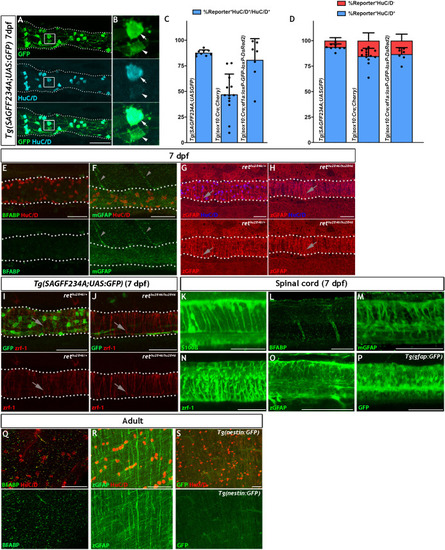
ENS lineage tracing shows that there is a small non-neuronal lineage that is not detectable using antibodies for the canonical glial markers BFABP, GFAP nor with transgenic reporters.(A) Using the Tg(SAGFF234A;UAS:GFP) line at 7 dpf to label the ENS lineage with GFP (green), we observe that the majority of these cells are HuC/D+ neurons (cyan) (n = 9). (B) High magnification view of box in A, with arrows denoting the GFP+HuC/D+ ENS neurons and arrowheads indicating GFP+HuC/D- non-neuronal ENS cells. (C) Comparison of the efficiency of various transgenic reporter lines used in this study in their ability to label HuC/D+ ENS neurons within the 7 dpf larvae. Tg(SAGFF234A;UAS:GFP) labels 87.8% ± 2.8 of HuC/D+ ENS neurons, Tg(sox10Cre;Cherry) labels 47.1% ± 19.9 of HuC/D+ ENS neurons, and Tg(sox10:Cre;ef1a:loxP-GFP-loxP-DsRed2) labels 80.8% ± 7.8 of HuC/D+ ENS neurons. Data are given as mean ± SD, n = 9 biological replicates. (D) Comparison of the proportion of HuC/D+ ENS neurons (blue) vs. HuC/D- non-neuronal ENS cells (red) labelled by the various transgeneic reporter lines within the 7 dpf ENS lineage. The majority of cells labelled by either Tg(sox10Cre;Cherry) or Tg(sox10:Cre;ef1a:loxP-GFP-loxP-DsRed2) lineage reporter lines are neurons, each labelling approximately 85% HuC/D+ cells and 15% HuC/D- cells (84.8% ± 7.7% and 15.2% ± 7.7 vs. 86.8% ± 6.4 and 13.2 ± 6.4%, respectively), a non-significant difference (p=0.78). Tg(SAGFF234A;UAS:GFP) labels 93.7% ± 3.0 of HuC/D+ neurons and 6.2% ± 3.0 of HuC/D- cells, a significant difference in proportional cell type labelling efficiency relative to both sox10Cre-driven lineage reporters (p=0.0078 and p=0.09, respectively). Data are given as mean ± SD, n = 9 biological replicates. (E–J). The larval zebrafish ENS is not labelled with BFABP and GFAP antibodies. (E) BFABP (green) fails to mark EGCs in the 7 dpf intestine, despite HuC/D neurons (red) being readily detected (n = 20). (F) The mammalian GFAP antibody (mGFAP, green) does not detect cells in the 7 dpf gut, despite HuC/D positive neurons being detectable (red) (n = 26). Instead, mGFAP fibres are seen descending toward, but not entering, the gut (arrowheads). (G–H) An antibody raised against zebrafish GFAP (zGFAP) detects abundant circumferential fibres in the 7 dpf gut (red, arrows), positioned near HuC/D+ ENS neurons (blue). However identical staining is observed in wild type larvae that contain ENS neurons (G, n = 6) and rethu2846/hu2846 which lack an ENS due to a mutation in the Ret receptor tyrosine kinase and a failure of ENS progenitors to colonise the gut (H, n = 6) (HuC/D+ neurons only present in G, blue). (I–J) Immunostaining of 7 dpf Tg(SAGFF234A;UAS:GFP) larvae with another GFAP antibody raised against zebrafish GFAP (zrf-1) also reveals abundant circumferential fibres (red, arrows), in a pattern indistinguishable between wild type larvae containing ENS neurons (green) (I, n = 10) and rethu2846/hu2846 larvae lacking ENS neurons (green, J, n = 10), indicating that these fibres are not associated with the ENS lineage. (K–O) Antibodies tested in the above experiments to detect ENS glial cells are able to successfully label CNS glial cells in the 7 dpf spinal cord: S100b (K, n = 30), BFABP (L, n = 20), mGFAP (M n = 26), zrf-1 (N, n = 20,) zGFAP (O, n = 12). (P) The expected pattern of GFP+ cells are detected within the spinal cord of 7 dpf Tg(gfap:GFP) larvae (n = 50). (Q–S) Analysis of adult gut tissue using a variety of antibody and transgenic tools used to identify CNS glial cells. (Q) BFABP is not detected in the adult gut despite HuC/D (red) identifying HuC/D+ enteric neurons (n = 9). (R) Although signal is detected in the adult gut using the zGFAP antibody (green), the striated signal is not found in cell bodies, nor is it clearly associated with HuC/D neurons (red) and the staining pattern is reminiscent of the non-ENS associated staining seen at 7 dpf (n = 12). (S) GFP+ cells are not observed in adult Tg(−3.6nestin:GFP) gut tissue, despite the ready detection of HuC/D+ neurons (red) (n = 4). All confocal images are max projections of short confocal stacks. 50 µm scale bars in merge panels (A, E–J, Q–S) or single colour images (K–P).
|

