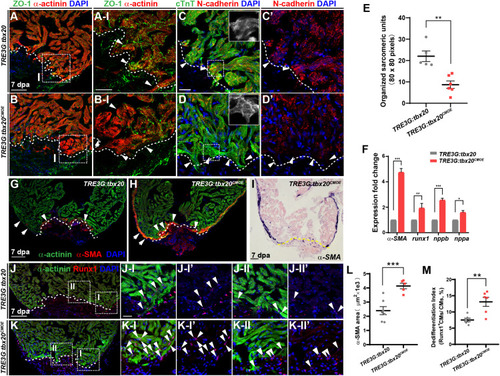
tbx20 overexpression in the adult myocardium enhances CM dedifferentiation after injury. (A–D,G,H,J,K) Representative confocal fluorescence images of sections of injured ventricles from Tg(TRE3G:tbx20) and Tg(TRE3G:tbx20CMOE) zebrafish co-stained with antibodies against ZO-1 (green) and α-actinin (red) (A,B), cTnT (green) and N-cadherin (red) (C,D), α-SMA (red) and α-actinin (green) (G,H), and Runx1 (red) and α-actinin (green) (J,K). DAPI was used to stain nuclei. Boxed areas in (A,B,J,K) are magnified on the right with split channels. Insets in (C,D) show enlarged images of the dashed boxes. Arrowheads in (A-I, B-I) indicate CMs with disassembled sarcomeric structure in the border zone adjacent to the injury site. Arrowheads in (C,D) point to CMs adjacent to the injury site. Arrows and arrowheads in (G,H) indicate α-SMA+ cells in the regenerating compact layer and trabecular layer, respectively. Arrowheads in (J,K) indicate Runx1+α-actinin+ CMs. (E) Quantification of organized sarcomeric units in cTnT-labeled myocardium (80 × 80 pixels) in border zone from 7 dpa ventricle sections of Tg(TRE3G:tbx20) (C, n = 5) and Tg(TRE3G:tbx20CMOE) (D, n = 6) zebrafish. (F) Statistical analyses of qPCR for α-SMA, runx1, nppb and nppa in the injured ventricle apices from Tg(TRE3G:tbx20) and Tg(TRE3G:tbx20CMOE) zebrafish at 7 dpa. (I) Representative images of ISH with α-SMA on 7 dpa heart sections from Tg(TRE3G:tbx20CMOE) fish. (L) Dot plot showing the area of α-SMA stained on heart sections in (G, n = 7) and (H, n = 5). (M) Dot plot showing the percentage of Runx1+α-actinin+ cells in the border zone in (J,K), n = 6 in each group. All fish were treated with DOX as described in Figure 2B and hearts were harvested at 7 dpa. Dashed lines delineate injured area. The values in (E,F,L,M) are mean ± SEM, ∗p < 0.05, ∗∗p < 0.01, ∗∗∗p < 0.001. Scale bar: 50 μm (A,B); 20 μm (A-I,B-I,C-D’,J-I-K-II”); 100 μm (G–K).
|