
Figure 4
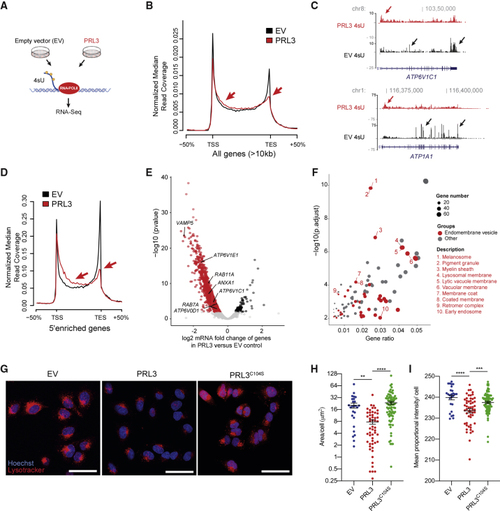
PRL3 Restrains Transcriptional Elongation of Endomembrane Vesicle Genes (A) Schematic of 4sU protocol to detect nascent RNA transcripts. (B) 4sU transcriptional profile for long genes in EV (empty vector) versus (C) 4sU RNA-seq transcript coverage for (D) 4sU transcriptional profile for 5′-enriched genes in control and (E) Volcano plot of differentially expressed genes in PRL3 versus EV control A375 cells by DESeq2-analysis using 4sU nascent RNA-seq data. See also (F) Bubble plot of GO cellular components in the (G) A375 melanoma cells expressing EV, PRL3, and PRL3 (C104S) stained with LysoTracker (red) and hoechst (blue). Scale bars: 50 μm. (H) Quantification of the area of LysoTracker-positive vesicles per cell. ANOVA using Tukey’s analysis, ∗∗p = 0.0015; ∗∗∗∗p < 0.0001. Line and error bars, mean ± SEM. (I) Quantification of the proportional mean intensity of LysoTracker-positive vesicles per cell. ANOVA using Tukey’s analysis, ∗∗∗p = 0.0005; ∗∗∗∗p < 0.0001. Line and error bars, mean ± SEM. See also |
Reprinted from Developmental Cell, 54(3), Johansson, J.A., Marie, K.L., Lu, Y., Brombin, A., Santoriello, C., Zeng, Z., Zich, J., Gautier, P., von Kriegsheim, A., Brunsdon, H., Wheeler, A.P., Dreger, M., Houston, D.R., Dooley, C.M., Sims, A.H., Busch-Nentwich, E.M., Zon, L.I., Illingworth, R.S., Patton, E.E., PRL3-DDX21 Transcriptional Control of Endolysosomal Genes Restricts Melanocyte Stem Cell Differentiation, 317-332.e9, Copyright (2020) with permission from Elsevier. Full text @ Dev. Cell