
Fig. 4
- ID
- ZDB-FIG-200723-49
- Publication
- Xu et al., 2020 - Unifying Developmental Programs for Embryonic and Post-Embryonic Neurogenesis in the Zebrafish Retina
- Other Figures
- All Figure Page
- Back to All Figure Page
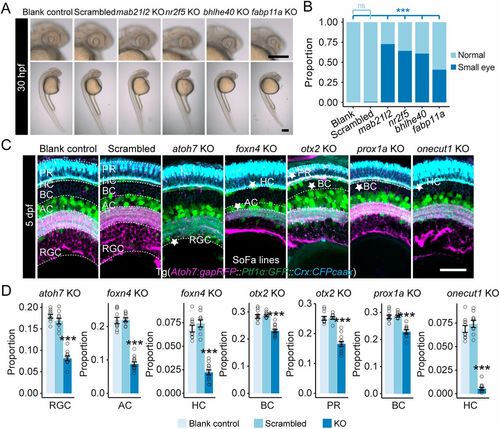
Individual developmental states represent various aspects of retinal development. (A) Representative images showing small eyes at 30?hpf as the result of disruption of Cluster 1-specific marker genes (mab21l2, nr2f5, bhlhe40 and fabp11a). Scale bars: 120??m. (B) Plot showing the proportions of small eyes at 30?hpf as the result of disruption of individual Cluster 1-specific marker genes. ***P<0.001 (Fisher's exact test compared with the blank control). ns, no significant difference. (C) Confocal images of the retinas (coronal view) of SoFa fish lines at 5?dpf after disruption of Cluster 3- (atoh7, foxn4), Cluster 4- (otx2, prox1a) and Cluster 5- (onecut1) specific marker genes. The cell types that decreased significantly in cell number are labeled with stars. Scale bar: 30??m. (D) Quantitative plots showing the proportions of cell types that decreased significantly in cell number from corresponding gene disruption groups in C (data are mean�s.e.m., data points are shown). ***P<0.001 (Wilcoxon test compared with the control groups). KO, knockout. |