Fig. 4
|
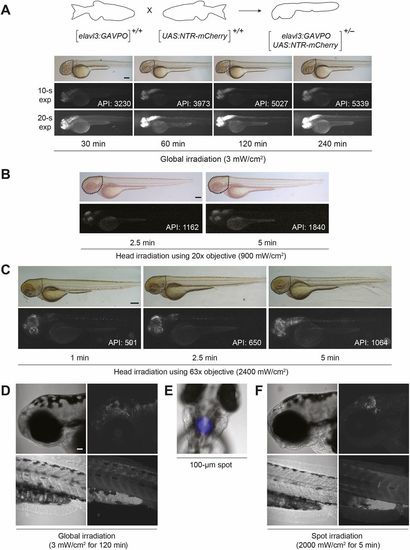
Light-inducible, neuron-specific gene expression using the GAVPO system. (A) Tg(elavl3:GAVPO;UAS:NTR-mCherry)embryos were irradiated for varying durations, using a blue LED lamp and starting at 48?hpf. The embryos were then imaged 8?h later, and representative bright-field and epifluorescence micrographs (with short or long exposure times) are shown. NTR-mCherry was expressed in neural tissues, at levels that increased with the length of irradiation. Dashed outlines indicate the region used to determine the average pixel intensity (API) for each micrograph. (B,C) The heads of 48 hpf Tg(elavl3:GAVPO;UAS:NTR-mCherry) embryos were irradiated using an epifluorescence microscope equipped with a 470/40 nm filter and either a 20× (B) or 63× (C) objective. The embryos were imaged 8?h later, and representative bright-field and epifluorescence micrographs are shown. NTR-mCherry expression was observed in anterior neural tissues, at levels that increased with the duration and intensity of irradiation. Dashed outlines indicate the region used to determine the average pixel intensity (API) for each micrograph. (D-F) Tg(elavl3:GAVPO;UAS:NTR-mCherry) embryos were illuminated either globally using a blue LED lamp (D) or within a 100 µm diameter region in the head using an epifluorescence microscope equipped with a 470/40 nm filter, 20× objective and iris diaphragm (E,F). Representative bright-field and confocal fluorescence micrographs from two independent experiments are shown, and total sample sizes are indicated. LED illumination induced NTR-mCherry expression throughout the head, whereas spot-irradiated embryos exhibited mCherry fluorescence in only a localized anterior region. Embryo orientations: A-D,F, lateral view and anterior left; E, dorsal view, anterior up. Scale bars: 200?µm in A; 300?µm in B,C; 50?µm in D-F. Statistics for the observed phenotypes are in Table S4. |

