
Figure 4
- ID
- ZDB-FIG-200720-12
- Publication
- Amorim et al., 2020 - A Conserved Notochord Enhancer Controls Pancreas Development in Vertebrates
- Other Figures
- All Figure Page
- Back to All Figure Page
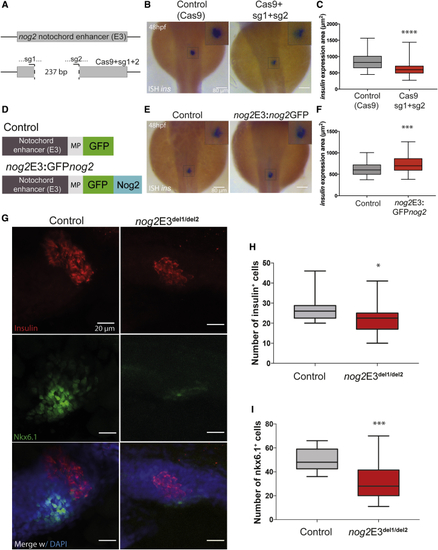
The (A) Representation of the WT nog2E3 enhancer (above) and somatic deletions (below) generated by the injection of the Cas9 protein, together with sg1 and sg2 targeting two regions of the sequence 237 bp apart (see also (B) (C) Quantification of the (D) Diagram of the nog2E3:GFPnog2 construct used to achieve notochord-specific overexpression of GFPnog2 and the respective control. (E) (F) Quantification of the (G) Representative confocal images of 48 hpf zebrafish embryos counterstained with a DAPI nuclear marker (blue), an anti-insulin antibody marking β cells (red), and an anti-Nkx6.1 antibody marking pancreatic progenitor cells (green). Images represent the maximum-intensity z projection of several focal planes obtained in a Leica Sp5 confocal microscope using a 40× objective. Scale bars represent 20 μm. (H) Quantification of the number of insulin-expressing cells in nog2E3del1/del2 embryos compared with controls (n ≥ 19). Error bars represent SD; ∗p < 0.05. (I) Quantification of the number of nkx6.1-expressing cells in nog2E3del1/del2 embryos compared with controls (n ≥ 13). Error bars represent SD; ∗∗∗p < 0.001. |
| Gene: | |
|---|---|
| Antibodies: | |
| Fish: | |
| Knockdown Reagents: | |
| Anatomical Terms: | |
| Stage: | Long-pec |
| Fish: | |
|---|---|
| Knockdown Reagents: | |
| Observed In: | |
| Stage: | Long-pec |