|
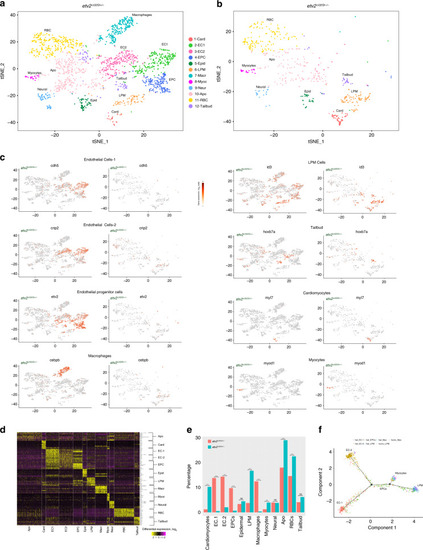
Single-cell RNA-seq analysis of <italic>etv2</italic><sup><italic>ci32Gt</italic></sup><italic>; UAS:GFP</italic> heterozygous and homozygous embryos at the 20-somite stage.a, b t-SNE plots and cell clustering analysis. Twelve different clusters were identified. Card cardiomyocytes, EC endothelial cells, EPC endothelial progenitor cells, Epid epidermal cells, LPM lateral plate mesoderm, Macr macrophages, Myoc myocytes, Neur neural, Apo putative pro-apoptotic cells, RBC red blood cells, Tailbud tailbud progenitors. c t-SNE plots showing selected top markers for different cell types. d Heatmap of marker gene expression in different cell populations. e The proportions of GFP+ cell types in etv2ci32Gt+/− and etv2ci32Gt−/− embryos. Note a great reduction in EC1, EC2, EPC, and macrophage populations and an increase in LPM, cardiomyocyte, myocyte, RBC, and Apo populations in etv2 mutants. ***p < 0.001, NS not significant, chi-square test. p Values: Card—5.0 × 10⁻²⁶, EC1— 6.2 × 10⁻¹⁸, EC2—1.8 × 10⁻¹⁴, EPCs—2.4 × 10⁻¹¹, Epid—0.66, LPM—8.4 × 10⁻²⁷, Macr—2.5 × 10⁻¹⁶, Myoc—3.4 × 10⁻⁴, Neur—1.0, Apo—1.9 × 10⁻⁷, RBC—1.1 × 10⁻⁴, Tailbud—0.21. Totally, 2049 and 588 cells total from etv2ci32Gt+/− and etv2ci32Gt−/− embryos, respectively, were analyzed in a single scRNA-seq experiment. f Pseudotime analysis graph of cells in LPM, EPC, EC1, EC2, and myocyte populations in etv2ci32Gt homozygous and heterozygous embryos.
|