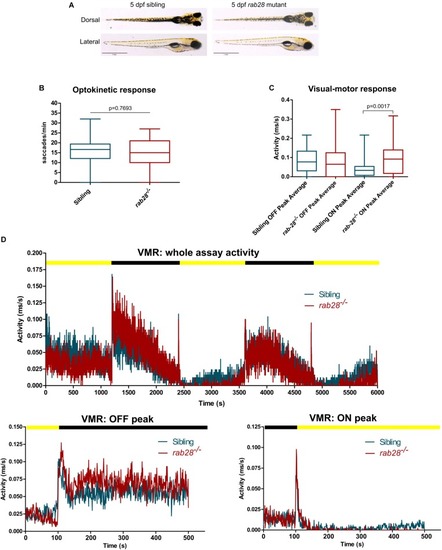
rab28 knockout zebrafish have subtle defects in visual behavior at 5 dpf. (A) Representative images of rab28 knockout and sibling zebrafish larvae at 5 dpf. Gross morphology is indistinguishable between knockouts and siblings. (B) Box and whisker plot of the optokinetic response (OKR) of rab28 knockout larvae versus sibling larvae at 5 dpf. OKRs are not significantly different. Box extremities represent 1st and 3rd quartiles; whiskers are maximum and minimum values. p-Value derived from unpaired t-test. OKR data are from 32 mutants and 98 siblings, across three experimental replicates. (C) Box and whisker plot of 5 dpf larval activity during the visual-motor response (VMR) assay. OFF peak activity is identical between rab28 knockouts and siblings, albeit rab28 knockouts have an average 51% higher ON peak activity. Data are from three independent replicates and are the average of 5 s of activity following light changes. Box extremities represent 1st and 3rd quartiles; whiskers are maximum and minimum values. p-Value derived from unpaired t-test. (D) Activity traces showing 5 dpf larval activity over the course of an entire VMR assay (100 min), as well as separate graphs showing activity 100 s before and 400 s after OFF and ON peaks, respectively. Black and yellow bars indicate dark and light conditions, respectively. VMR data are from 32 mutants and 49 siblings, across three experimental replicates.
|
