
Figure 3
- ID
- ZDB-FIG-191230-1457
- Publication
- Pedroni et al., 2019 - Large-Scale Analysis of the Diversity and Complexity of the Adult Spinal Cord Neurotransmitter Typology
- Other Figures
- All Figure Page
- Back to All Figure Page
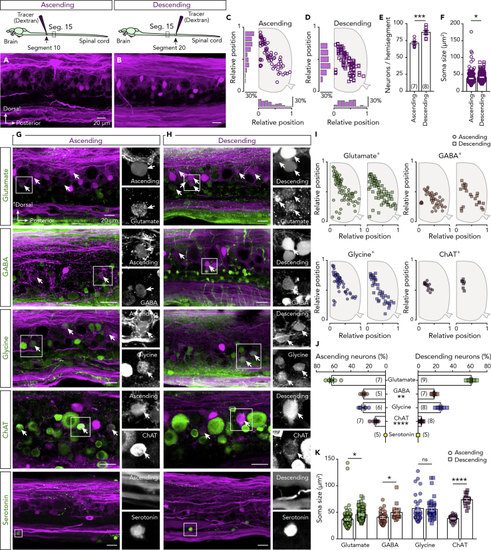
Neurotransmitter Phenotype of Projecting Neurons (A and B) Injection of a dextran tracer in segment 10 or 20 reveals the ascending and descending spinal projecting neurons, respectively, located in spinal cord segment 15. (C and D) Setting positions of the tracer-labeled ascending (circles) and descending (squares) neurons that project to the rostral or caudal part of the spinal cord revealed in one representative preparation. (E) Quantification of the total number of ascending and descending neurons detected in the spinal cord hemisegment. (F) Plot showing the soma sizes of the tracer-labeled ascending and descending neurons (Ascending: (G and H) Double staining between ascending or descending traced neurons (magenta) with glutamate, GABA, glycine, ChAT, and serotonin (green). Arrows indicate the double-labeled neurons. On the right side, there are single channel magnifications of the boxed area. (I) Spatial distribution of the ascending (circles) and descending (squares) traced neurons that express a specific neurotransmitter phenotype. (J) Quantification of percentage of tracer-positive ascending and descending projecting neurons expressing each neurotransmitter phenotype. (K) Soma sizes of the tracer-positive ascending (circles) and descending (squares) projecting neurons. Data are presented as mean ± SEM; *P < 0.05; **P < 0.01; ***P < 0.001; ****P < 0.0001; ns, non-significant. For antibodies information, see also |
| Antibodies: | |
|---|---|
| Fish: | |
| Anatomical Term: | |
| Stage: | Adult |