
Figure 2
- ID
- ZDB-FIG-191230-1456
- Publication
- Pedroni et al., 2019 - Large-Scale Analysis of the Diversity and Complexity of the Adult Spinal Cord Neurotransmitter Typology
- Other Figures
- All Figure Page
- Back to All Figure Page
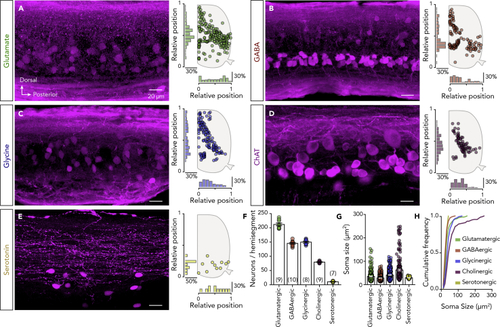
Neurotransmitter Phenotypes of the Adult Zebrafish Spinal Neurons (A–E) Representative whole-mount photomicrographs showing part of the immunolabeled cells for glutamate, GABA, glycine, ChAT, and serotonin, followed by a schematic representation of the spatial distribution with the corresponding medio-lateral and dorsoventral density plots from a single adult zebrafish spinal cord hemisegment. (F) Quantification of the total number of the labeled neurons expressing a specific neurotransmitter phenotype. (G and H) Quantification and cumulative frequency of labeled neurons soma size. Data are presented as mean ± SEM. For related data and antibodies information, see also |
| Antibodies: | |
|---|---|
| Fish: | |
| Anatomical Term: | |
| Stage: | Adult |