|
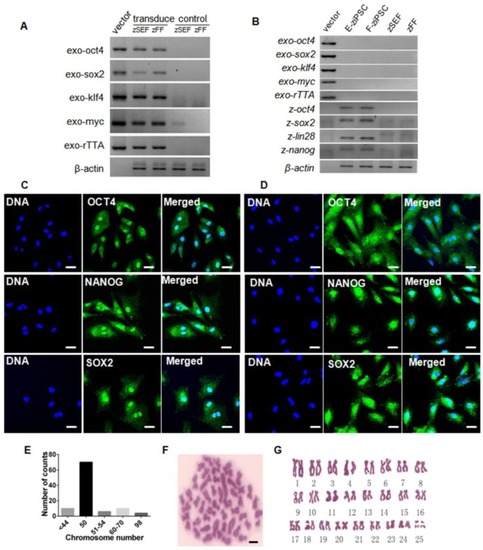
Characterization of zebra fish iPS-like cells. (A) RT-PCR analysis of exogenous rTTA, oct4, sox2, klf4 and c-myc in zSEFs and zFFs at 7-day post-transduction. At least three independent experiments were conducted for these results). (B) RT-PCR analysis of endogenous oct4, sox2, lin28, and nanog in the E-ziPSCs (passage 20) and F-ziPSCs (passage 18) (At least three independent experiments were conducted for these results). (C) Immunofluorescence staining of Oct4, Nanog, and Sox2 in E-ziPSCs (passage 20) (Scale bars represent 20 μm). (D) Immunofluorescence staining of Oct4, Nanog, and Sox2 in F-ziPSCs (passage 18) (Scale bars represent 20 μm). (E) Distribution of chromosome numbers among 100 F-ziPSCs metaphases (passage 18-30). (F) A metaphase plate of the chromosomes of a diploid F-ziPSC (2n = 50) after Giemsa staining (Scale bar represents 10 μm). (G) Diploid karyotype of an F-ziPSC (homologous chromosomes were paired according to their sizes).
|