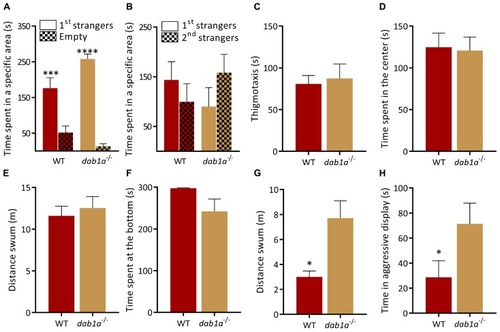
Behavior of dab1a–/– zebrafish. (A,B) Social preference test. (A) Both genotypes prefer to spend time near a group of unfamiliar fish [1st strangers; p = 0.0005 and p < 0.0001 respectively; two-way ANOVA followed by Sidak’s post hoc, genotype factor: F(1,30) = 0.9841, p = 0.3291, stranger factor: F(1,30) = 72.81, p < 0.0001, interaction genotype × stranger: F(1,30) = 7.716, p = 0.0093]. (B) WT and dab1a–/– spend equal time near both groups when a second unfamiliar group is added [p = 0.61 for WT and p = 0.44 for dab1a–/–; two-way ANOVA followed by Sidak’s post hoc, genotype factor: F(1,30) = 0.004, p = 0.95, stranger factor: F(1,30) = 0.1016, p = 0.75, interaction genotype × stranger: F(1,30) = 2.175, p = 0.15. n = 10 wild-type and n = 7 dab1a–/–]. (C–E)dab1a–/– exhibit normal behavior in the open field test. (C) Time at side of the tank [thigmotaxis, t-test (Welch): t(0.3262) = 9.971, p = 0.75] and (D) time in center of the tank [t-test (Welch): t(0.1684) = 14.64, p = 0.87] (E) locomotion [t-test (Welch): t(0.5277) = 13.05, p = 0.61. n = 10 wild-type and n = 7 dab1a–/–]. (F)dab1a–/– exhibit normal anxiety-like behavior. Time at the bottom of novel tank (Mann–Whitney test: U = 17, p = 0.06). (G)dab1a–/– fish are more active than WT in the NTT [t-test (Welch): t(3.234) = 7.409, p = 0.0133. n = 10 wild-type and n = 7 dab1a–/–]. (H)dab1a–/– display heightened aggression levels compared to WT (Mann–Whitney test: U = 11.5, p = 0.0445. n = 10 wild-type and n = 7 dab1a–/–). ∗p < 0.05, ∗∗∗p < 0.001, ****p < 0.0001. Mean ± SEM.
|
