
Fig. S2
- ID
- ZDB-FIG-191024-7
- Publication
- Djannatian et al., 2019 - Two adhesive systems cooperatively regulate axon ensheathment and myelin growth in the CNS
- Other Figures
- All Figure Page
- Back to All Figure Page
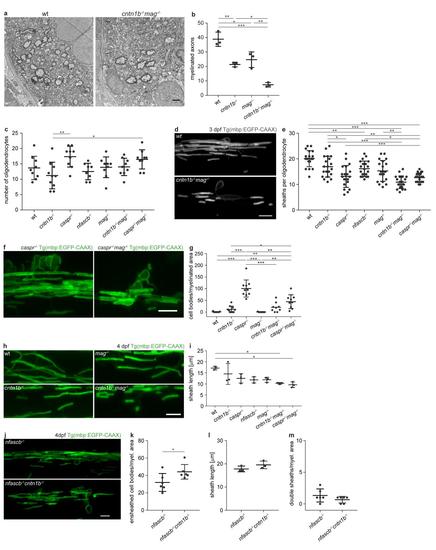
a Electron micrographs reperesent dorsal spinal cord cross-sections of 10 dpf wt and cntn1b-/-mag-/-zebrafish. b Total numbers of myelinated axons in electron micrographs of 10 dpf wt and mutant dorsal spinal cord cross-sections. n = 3 fish, one-way ANOVA: p < 0.0001. c Number of oligodendrocytes in 3 dpf anterior dorsal spinal cords of wt and mutant Tg(mbp:EGFP-CAAX) zebrafish larvae. n = 8-10 fish, one-way ANOVA: p < 0.0049. d Myelin sheaths of single oligodendrocytes in 3 dpf wild-type (top) and cntn1b-/-mag-/- (bottom) fish. e Number of myelin sheaths per oligodendrocyte in 3 dpf wt and mutant fish. Sheaths from 20 oligodendrocytes per genotype from 5-7 fish were quantified. One-way ANOVA: p < 0.0001. f Ensheathed cell bodies in 4 dpf caspr-/- (reproduced from Fig. 1a) and caspr-/-mag-/- fish. g Ensheathed cell bodies per myelinated area at 4 dpf (n = 8-10, one-way ANOVA: p = 0.0001). Quantifications for wt and single mutants were reproduced from Fig. 1b. h Representative wild type (wt) and mutant myelin sheaths of zebrafish commissural neurons at 4 dpf. i Sheath length at 4 dpf (means of 30 sheaths per animal, n = 3, one-way ANOVA, p < 0.0001). j-m CNS myelination of 4 dpf nfascb-/-cntn1b-/- fish in comparison to nfascb-/-littermates. (j) Representative images of CNS myelin. (k) Ensheathed cell bodies per myelinated area (n = 6, unpaired two-sided t test: p = 0.0482). (l) Sheath length (means of 30 sheaths per animal, n = 3, unpaired two-sided t test, p < 0.2111). (m) Double sheaths (sheaths with fluorescence intensity steps combined with caliber changes, as depicted in Fig. 4a) normalized to myelinated area (n = 6, unpaired two-sided t test, p < 0.1877). Confocal images (d,f,h,j) are maximum intensity projections of Tg(mbp:EGFP-CAAX) zebrafish dorsal spinal cord. Bonferroni-corrected p values, *0.05, **<0.01, ***<0.001. Data are presented as means � s.d. Scale bars, 1 ?m (a), 10 ?m (d,f,h,j). Source data are provided as a Source Data file. |