
Fig. 2
- ID
- ZDB-FIG-191007-3
- Publication
- Kunst et al., 2019 - A Cellular-Resolution Atlas of the Larval Zebrafish Brain
- Other Figures
- All Figure Page
- Back to All Figure Page
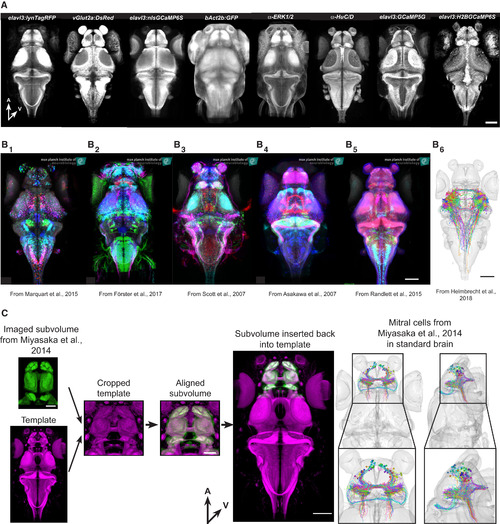
Integration of External Data (A) 8 examples of additional reference stains that can be used to align data to our resource. A, anterior; V, ventral. Scale bar represents 100 μm. (B) Examples of Gal4-line expression patterns and single-neuron tracings from different projects aligned to our common coordinate system. (B1) Enhancer-trap (ET) lines expressing UAS-Kaede from Marquart et al. (2015). (B2) BAC-trangenic lines expressing UAS-Dendrafrom Förster et al. (2017). (B3) ET lines expressing UAS-Dendra from Scott et al. (2007). (B4) Enhancer-trap (ET) lines expressing UAS-GFPfrom Asakawa et al. (2008). (B5) Various expression pattern from Randlett et al. (2015). (B6) Tectal projection neurons from Helmbrecht et al. (2018). All scale bars represent 100 μm. (C) Integration of mitral cell tracing from Miyasaka et al. (2014). Our reference brain was cropped to match the template of the original data. After successful alignment, the cropped volume was reinserted into the full-site reference brain. The various transformation steps were also applied to the mitral cell tracings. A, anterior; V, ventral. Scale bars in subvolume represent 50 μm; all other scale bars represent 100 μm. |