
Fig. 6
- ID
- ZDB-FIG-190816-16
- Publication
- Rho et al., 2019 - Rap1b Promotes Notch-Signal-Mediated Hematopoietic Stem Cell Development by Enhancing Integrin-Mediated Cell Adhesion
- Other Figures
- All Figure Page
- Back to All Figure Page
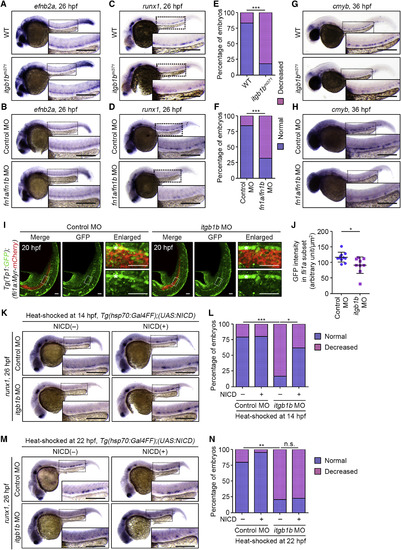
Itgb1b-Mediated Adhesion to Fn Regulates HE Specification (A) Expression patterns of efnb2a in 26 hpf sibling (WT) and itgb1bmi371embryos. (B) Expression patterns of efnb2a in 26 hpf control MO- and fn1a/fn1bMO-injected embryos. (C) Expression patterns of runx1 in 26 hpf sibling (WT) and itgb1bmi371embryos. (D) Expression patterns of runx1 in 26 hpf control MO- and fn1a/fn1bMO-injected embryos. (E) Percentages of embryos showing normal (blue) and decreased (pink) expressions of runx1 in the AGM regions, as observed in (C). WT, n = 12; itgb1bmi371, n = 11. ∗∗∗p < 0.001. (F) Percentages of embryos showing normal (blue) and decreased (pink) expressions of runx1 in the AGM regions, as observed in (D). Control MO, n = 31; fn1a/fn1b MO, n = 25. ∗∗∗p < 0.001. (G and H) Expression patterns of cmyb in 36 hpf sibling (WT) and itgb1bmi371 embryos (G) and in 36 hpf control MO- and fn1a/fn1b MO-injected embryos (H). (I) Confocal stack fluorescence images of trunk and tail regions of 20 hpf Tg(Tp1:GFP);(fli1a:Myr-mCherry) embryos injected with control MO (left) and itgb1b MO (right). Left, merged images of GFP (green) and mCherry (red); middle, GFP images; right, enlarged merged (upper) and GFP (lower) images of the boxed areas. Asterisks indicate notochord-derived Tp1:GFP signal. (J) Relative fluorescence intensity of Tp1:GFP in the fli1a:Myr-mCherry-labeled vascular cord, as observed in (I). Each dot represents an individual embryo. Error bars indicate means ± SD. Control MO, n = 11; itgb1b MO, n = 9. ∗p < 0.05. (K and M) Expression patterns of runx1 in 26 hpf control MO- and itgb1b MO-injected embryos heat shocked at 14 hpf (K) and 22 hpf (M) for 45 min with either WT or the Tg(hsp70:Gal4FF) background (NICD(‒), left column) and with the Tg(hsp70:Gal4FF);(UAS:NICD)background (NICD(+), right column). (L and N) Percentages of embryos showing normal (blue) and decreased (pink) expressions of runx1 in the AGM regions of embryos heat shocked at 14 hpf (L) and 22 hpf (N), as observed in (K) and (M). (L) Control MO/NICD(‒), n = 26; itgb1b MO/NICD(‒), n = 20; Control MO/NICD(+), n = 22; itgb1b MO/NICD(+), n = 22. (N) Control MO/NICD(‒), n = 33; itgb1b MO/NICD(‒), n = 29; Control MO/NICD(+), n = 13; itgb1b MO/NICD(+), n = 15. ∗p < 0.05; ∗∗p < 0.01; ∗∗∗p < 0.001; n.s., not significant. In (A)–(D), (G), (H), (K), and (M), boxed areas are enlarged in the insets. Scale bars: 200 μm (A–D, G, H, K, and M); 50 μm (I). |
| Genes: | |
|---|---|
| Fish: | |
| Condition: | |
| Knockdown Reagents: | |
| Anatomical Terms: | |
| Stage Range: | 20-25 somites to Prim-25 |
| Fish: | |
|---|---|
| Condition: | |
| Knockdown Reagents: | |
| Observed In: | |
| Stage Range: | 20-25 somites to Prim-25 |
Reprinted from Developmental Cell, 49(5), Rho, S.S., Kobayashi, I., Oguri-Nakamura, E., Ando, K., Fujiwara, M., Kamimura, N., Hirata, H., Iida, A., Iwai, Y., Mochizuki, N., Fukuhara, S., Rap1b Promotes Notch-Signal-Mediated Hematopoietic Stem Cell Development by Enhancing Integrin-Mediated Cell Adhesion, 681-696.e6, Copyright (2019) with permission from Elsevier. Full text @ Dev. Cell