
FIGURE
Fig. 6
- ID
- ZDB-FIG-190814-38
- Publication
- Ma et al., 2019 - A Comprehensive Study of High Cholesterol Diet-Induced Larval Zebrafish Model: A Short-Time In Vivo Screening Method for Non-Alcoholic Fatty Liver Disease Drugs
- Other Figures
- All Figure Page
- Back to All Figure Page
Fig. 6
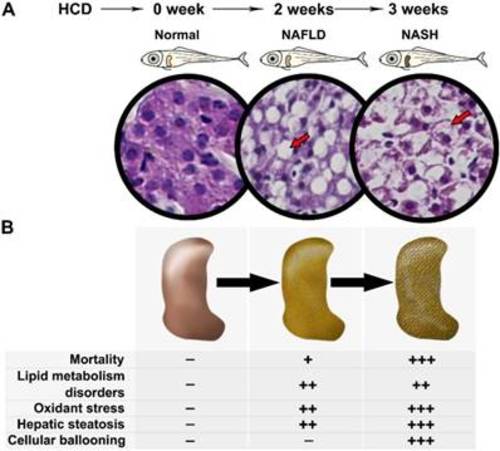
Spectrum of NAFLD on HCD induced larval zebrafish. (A) Processing of NAFLD on Larval zebrafish. (B) Multiple aspects changes in processing of NAFLD on Larval zebrafish.
|
Expression Data
Expression Detail
Antibody Labeling
Phenotype Data
Phenotype Detail
Acknowledgments
This image is the copyrighted work of the attributed author or publisher, and
ZFIN has permission only to display this image to its users.
Additional permissions should be obtained from the applicable author or publisher of the image.
Full text @ Int. J. Biol. Sci.