
Fig. 1
- ID
- ZDB-FIG-190814-35
- Publication
- Ma et al., 2019 - A Comprehensive Study of High Cholesterol Diet-Induced Larval Zebrafish Model: A Short-Time In Vivo Screening Method for Non-Alcoholic Fatty Liver Disease Drugs
- Other Figures
- All Figure Page
- Back to All Figure Page
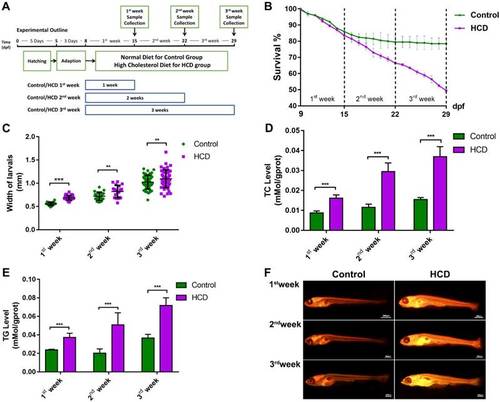
Effect of high cholesterol diet on metabolic profiles and lipid accumulation in larval zebrafish. (A) Experimental outline of HCD induced NAFLD larval zebrafish. (B) Survival rate of larval zebrafish (n=3). (C) Width changes of larval zebrafish (D) TC level of larval zebrafish (n=6). (E) TG level of larval zebrafish(n=6). (F) Nile red stain of larval zebrafish. Bar indicate means ± SD. n.s. P >0.05, *P <0.05, **P <0.01, ***P<0.001 represent significance of difference, P<0.05 was considered as statistically significant. Significant was calculated by ANOVA followed by turkey's test. n indicates the replicates of experiment.
|
| Fish: | |
|---|---|
| Condition: | |
| Observed In: | |
| Stage Range: | Days 7-13 to Days 21-29 |