|
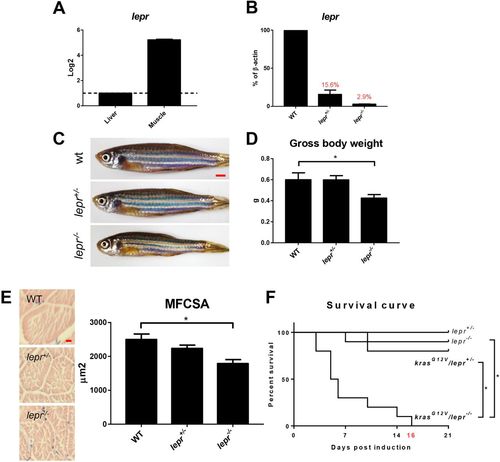
Expression of lepr and characterization of lepr mutant zebrafish. (A) RT-qPCR analyses of relative lepr mRNA expression in the liver and skeletal muscle in WT fish. The value of liver expression is arbitrarily set as 1. (B) RT-qPCR analyses of lepr mRNA expression in skeletal muscles in WT, lepr+/− and lepr−/− mutant zebrafish. Relative expression levels were the values with WT muscles set as 1. (C) Gross appearance of 4-month-old WT, heterogeneous and homogenous lepr mutant zebrafish. (D) Gross body weight. (E) H&E staining of muscle sections and quantification of MFCSA. (F) Survival curves after krasG12V induction in heterogeneous mutant fish, homogenous mutant fish and non-krasG12V controls. In each group, 10 fish were used to initiate the experiments. *P<0.05. Scale bars: 2.5?mm in C; 10?μm in E.
|