
FIGURE
Fig. 7
- ID
- ZDB-FIG-190618-61
- Publication
- Richardson et al., 2019 - Transcriptome profiling of zebrafish optic fissure fusion
- Other Figures
- All Figure Page
- Back to All Figure Page
Fig. 7
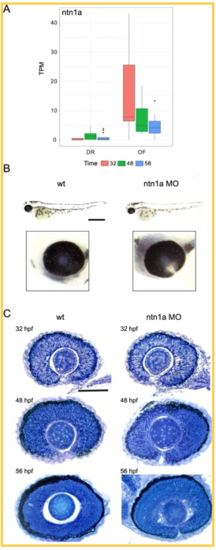
Failure of optic fissure fusion in ntn1a morphant zebrafish embryos. Expression levels (TPM, transcripts per million) of ntn1a candidate DEG showing temporal expression at 32,48 and 56 hours post fertilization (hpf) (A). (B) Wholemount and ocular morphology of 56 hpf wildtype (wt) and ntn1a morphant embryos, showing loss of ntn1a results in an ocular coloboma phenotype, scale bar 500 µm. (C) Histological analysis confirming loss of optic fissure fusion in ntn1a morphants. Scale bar 50 µm. |
Expression Data
Expression Detail
Antibody Labeling
Phenotype Data
| Fish: | |
|---|---|
| Knockdown Reagent: | |
| Observed In: | |
| Stage: | Long-pec |
Phenotype Detail
Acknowledgments
This image is the copyrighted work of the attributed author or publisher, and
ZFIN has permission only to display this image to its users.
Additional permissions should be obtained from the applicable author or publisher of the image.
Full text @ Sci. Rep.