
Fig. 1
- ID
- ZDB-FIG-181130-2
- Publication
- Bertuzzi et al., 2018 - Adult spinal motoneurons change their neurotransmitter phenotype to control locomotion
- Other Figures
- All Figure Page
- Back to All Figure Page
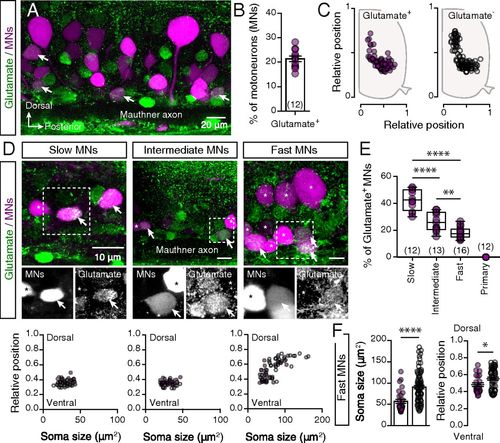
Analysis of the glutamatergic phenotype of adult spinal motoneurons. (A) Whole-mount fluorescence image of retrogradely traced motoneurons (MNs; magenta) and glutamate immunohistochemistry (green). (B) Percentages of the retrogradely traced motoneurons that express glutamate (n = 12 zebrafish). (C) Spatial distributions of the glutamate+ (solid circles) and glutamate− (open circles) immunoreactive motoneurons (n = 5 zebrafish). (D) Whole-mount immunofluorescent images (Top) showing the glutamatergic expression (green) in different motoneuron pools (magenta). Analysis of the soma sizes and dorsoventral locations of the glutamate and nonglutamate expressing motoneurons (Bottom). (E) The significantly differing percentages of retrogradely traced motoneurons that express glutamate in slow, intermediate, and fast pools (P < 0.0001, one-way ANOVA). (F) Glutamate-positive fast motoneurons (solid circles) were smaller (P < 0.0001, unpaired t-test) and located more ventrally (P = 0.0208, unpaired t-test) than the nonglutamate fast motoneurons (open circles). Arrows indicate the double-labeled cells. Asterisks indicate glutamate immunonegative motoneurons. Data are presented as mean ± SEM and as box plots showing the median and 25th and 75th percentile (box and line) and minimal and maximal values (whiskers). *P < 0.05; **P < 0.01; ****P < 0.0001. For detailed statistics see SI Appendix, Table S1. |