
Fig. 1
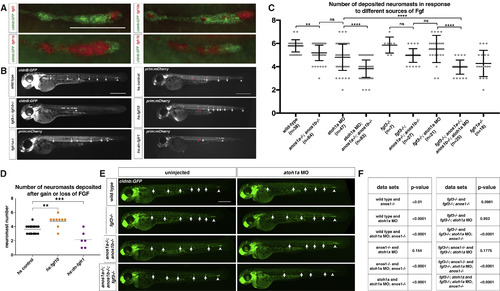
FGF Ligand and Receptor Expression and Function in Sensory Organ Formation (A) fgf3, fgf10a, fgfr1a, and fgfr1b mRNA expression (red) in the primordium (green) at 32 hpf. Scale bar represents 100 ?m. (B) Primordium position in embryos of indicated genotypes at 50 hpf. White arrows denote deposited neuromasts, arrowheads denote position of primordium, and red arrows indicate position of primordium at the beginning of the heat shock. Scale bar represents 500 ?m. (C) Plot of the number of neuromasts for (E) and (B). Mean, SD, and individual data points shown. ?? = p < 0.01, ???? = p < 0.0001, ns = not significant. ANOVA p < 0.0001. (D) Quantification of the number of neuromasts deposited after heat shock in embryos of the indicated genotypes. Mean, SD, and individual data points shown. ?? = p < 0.01, ??? = p < 0.001. ANOVA p < 0.0001. (E) Neuromast deposition (arrows) and primordium migration (arrowhead) in the embryos of indicated genotype at 50 hpf. Scale bar represents 500 ?m. (F) Table of p values calculated with Sidak's multiple comparisons test with a single pooled variance for the pairwise comparisons shown. ANOVA p < 0.0001. See also Figure S1 and Video S1. |
Reprinted from Developmental Cell, 46(6), Wang, J., Yin, Y., Lau, S., Sankaran, J., Rothenberg, E., Wohland, T., Meier-Schellersheim, M., Knaut, H., Anosmin1 Shuttles Fgf to Facilitate Its Diffusion, Increase Its Local Concentration, and Induce Sensory Organs, 751-766.e12, Copyright (2018) with permission from Elsevier. Full text @ Dev. Cell